Download Tutorial 2 Data and Solution File
Tutorial 2 guides the user through developing a CatchmentSIM project using GIS input data for a small rural catchment in NSW, Australia. The tutorial shows how to setup a DEM using GIS data, condition the DEM, breakup the subcatchment and intergrade the project with a third party hydrologic software package.
SETUP Project
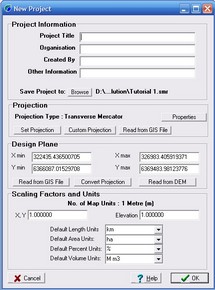
To begin a new project, select CatchmentSIM Drop Down >> New Project menu option.
Enter any relevant information in the Project Information text fields (these can be left blank if you wish).
Click the Browse button and enter the filename and location of your project.
You should now select the relevant projection / coordinate system for your project. The source data is in latitude and longitude (geographic coordinates), which needs to be converted to a Cartesian coordinate system in order to calculate geometric lengths and areas (Projects can be completed in geographic coordinates, however area and length derived parameters will not be evaluated).
Click the Set Projection button and select Map Grid of Australia 1994 (MGA 1994) from the top field and then select MGA Zone 56 (GDA94) from the bottom field. This map projection is the official map projection associated with the GDA94 datum which is the new geocentric datum adopted by Australia.
Once you have finished the tutorial you can try repeating the project in other Australian projections such as Albers / Lamberts Conformal Conic Equal Area projections to see if results vary. Any method of projecting a ellipsoidal earth surface onto a flat Cartesian map representation introduces distortion into a project. As such projections should be chosen carefully based on the alignment of the catchment, quantities to conserve (angles, lengths, areas etc) and many other factors.
Enter the X & Y design plane extents for the project. The region defined by these coordinates is the design plane and all source data will be clipped at its intersection with this plane. This ensures that file sizes and processing times are minimised. Let's assume that in this case we don't know the coordinates of our desired design plane in the MGA94 coordinate system, rather we know the lat/long coordinates for our design plane. CatchmentSIM can convert these values into the map projection you have selected using the Convert Projection button.
Firstly, enter the lat/long design plane coordinates in the boxes (southern longitudes and western latitudes should be entered as negative numbers):
Xmin: 151.1030
Ymin: -32.8289
Xmax: 151.1522
Ymax:-32.7990
Now click the Convert Projection button. You will be asked to select the source projection of the information which is Lat/Long. This should be selected as the default so click OK.
You will then be prompted to select the projection to convert the coordinates to, which should be the map projection. This should be the same as the aforementioned projection, ie., 'Map Grid of Australia 1994 (MGA 1994)' from the top field and 'MGA Zone 56 (GDA94)' from the bottom field (which should be selected as the default). Click OK.
You should notice that the coordinates have been converted to the MGA94 based projection.
The scaling factors enable coordinate systems and elevations scales that are not in metric m x m grid formats to be used with CatchmentSIM. In this case, the grid and elevations are in metres and hence the scaling factors should be assigned the default value of 1.00.
The completed New Project form should look similar to the following:
Click OK.
Import Source DAta
To import vector contour source data, select GIS >> Contours.
Select the mid/mif files for import, in this case "contour-data.mif". 3D vector data files in Mid/Mif format consist of two files, one with the 2D vector line network coordinates (the *.mif file) and the other consisting of a comma separated value (CSV) file that lists the various attributes of each line or polyline (the *.mid file). Hence, the elevation of each line is stored as a 'column' in this file. You need to select the column that stores the elevation data from the list of column titles, which are displayed in the Import Data form.
For this tutorial, elevation data is stored in the column titled 'Height m Integer'. Select this column in the scroll-box and press OK. The 3D contour data should now have been imported into the project. The contour data has been projected 'on the fly' into the project from its original geographic coordinates (open the contour-data.mif file with a text editor and you can see the original coordinates).
If available, stream data is very useful in a CatchmentSIM project. To import this data use the GIS >> Streams menu option. This time, you do not need to select a column number for elevation assignment since stream data is 2D only, so just press OK.
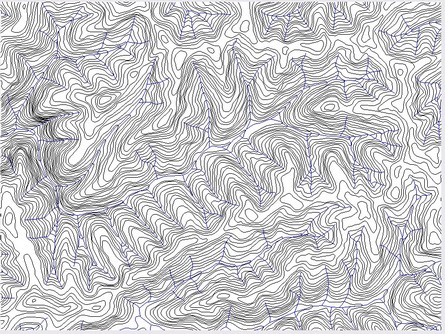
At this stage you should be able to see the imported contour and stream data on the screen (refer image below). Should you wish to turn one or more of these layers off or change their colours, try using the Layer Control.
If you wish, you can manually digitise additional contours or streams directly on the screen into a CatchmentSIM project. This shouldn't be necessary for this tutorial.
developing the dem
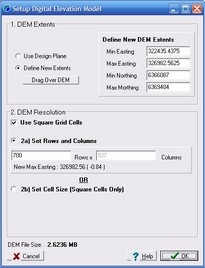
The Digital Elevation Model (DEM) forms the foundation of the bulk of CatchmentSIM's tools. The DEM is a grid (raster) structure where every grid cell is given an individual elevation value. To setup a blank DEM (i.e., DEM with no elevation data) select Create DEM >> Setup Blank DEM. This form prompts you to enter coordinate extents for the DEM or use the same extents as the project. This allows you the opportunity to select a smaller area than your project design plane for analysis. Generally, the region bounded by the DEM extents should be the smallest rectangle possible that fully encloses the catchment of interest.
For this tutorial, using the existing design plane will be fine, so just select the Use Design Plane radio-button.
The file size and processing times for CatchmentSIM projects are largely affected by the size of the DEM, where size refers to the total number of grid cells (pixels) rather than the spatial extents of the DEM. For this example, set the number of rows to 700 rows. You will notice that the number of columns is automatically calculated to be 937 since a square cell DEM is being used (refer image below). You may also notice that the 'define new extents' radio button has also been selected and the new DEM extents are automatically filed. This is because a square cell DEM will not fit exactly into the design plane and the max easting is actually being shortened by almost a metre to ensure the DEM cells are square. If you don't want to force the DEM to have square cells you can uncheck the 'Use Square Grid Cells' checkbox and manually set both the number of rows and columns. You also have an option of setting the DEM cell resolution explicitly (Option 2b).
At this stage the DEM has been created but pixel elevations have not been defined. The process of determining an elevation for every pixel is achieved by a number of sequential steps, namely:
1.Rasterisation of contour data;
2.Interpolation of streams / flow lines (if available);
3.Interpolation of Interpolation Training Lines (ITLs) (if available & required);
4.Interpolation of the DEM; and,
5.Stream burning.
These steps have been automated in a DEM Interpolation Wizard but can be accessed individually from the Create DEM >> Interpolation Tools submenu. For the purposes of this tutorial we will use these commands individually so you are able to see their effect on the DEM.
RASTERISATION OF CONTOUR DATA
Contour data is transferred into the DEM by assigning selected pixels that underlie the vector contour data with the elevation attribute of the contour line.
Select Create DEM >> Interpolation Tools >> Interpolate elevations from Contours. After this process is complete you should be able to see the elevation colour-coded assigned DEM pixels underlying the vector contour data. You should also be able to see the elevation of a DEM pixel in the lower right hand corner of the screen when you position the mouse over an assigned DEM pixel.
interpolation of streams
Since the imported stream GIS data is 2D only, it can not be incorporated into the DEM in the same fashion as the contour data. Rather, the streams are incorporated by interpolating values of pixels along the stream alignment in between intersected contour lines.
Select Create DEM >> Interpolation Tools >> Interpolate elevations along streams. You should see that pixels underlying stream alignments have been interpolated an intermediate elevation value between the intersected contour lines. This provides a valuable representation of troughs in the terrain and results in a much more realistic interpolated DEM.
interpolation of interpolation training lines (ITL)
ITLs are lines that can be digitised directly on the screen into the CatchmentSIM project. These lines can be added to a project to improve the DEM interpolation and are generally placed along expected ridge lines or flow-paths. ITLs should not be necessary for this tutorial.
interpolation of the dem
At this stage, you will notice that pixels underlying contour or watercourse lines have been assigned an elevation (and a corresponding colour), however the bulk of the DEM will still be unassigned. These pixels are assigned elevations by interpolating their value from surrounding pixels.
Select DEM >> Interpolation Tools >> Interpolate Remaining Areas. You need to assign corner elevations for the DEM. The algorithm has 'guessed' these values by looking at nearby contours but you can adjust them if necessary. For this tutorial, the current values will suffice. The number of interpolation rays indicates the number of directions the interpolation algorithm will look in when searching for nearby assigned pixels. The higher the value you select, the more accurate the DEM will be and the longer the interpolation will take. 16 rays are almost always good enough and should be selected for this tutorial. Press OK.
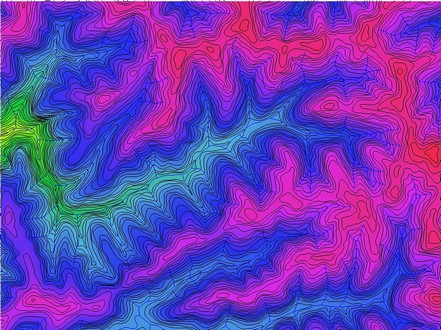
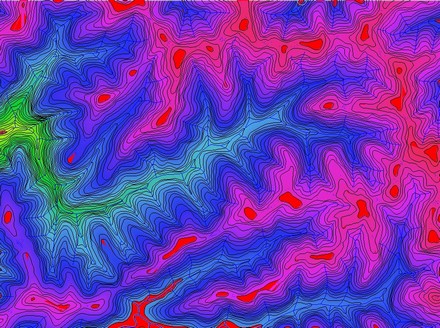
Following interpolation of the DEM, you should see that all DEM pixels have been assigned elevation values as shown below.
stream burning
At this stage, you may wish to implement stream burning. This is the process of lowering all pixels that underlie a stream line by a set increment (default of 0.5 m). This has the effect of ensuring that once a pixel flow path intersects a stream line, flow will be forced to follow the stream until leaving the catchment. Otherwise, flow paths may deviate slightly from the imported stream network in order to follow the steepest downslope path (this is not always represented by the imported stream network). Stream Burning is not required, but it is recommended if the automated catchment breakup algorithm is to be used.
For this tutorial stream burning should be applied. Select DEM Conditioning >> Burn Streams. A dialog box will appear asking for the burn depth to be specified. Adopt the default value of 0.5 metres and click OK.
hydrologic treatment of dem
Although the DEM has now been developed, it may not yet be ready for use to delineate the catchment. The DEM will probably contain flat or pit pixels, that is, pixels that are either equal or lower in elevation than the lowest of their neighbouring pixels. These pixels are usually the result of lack of source data definition or anomalies resulting from the interpolation algorithm.
Flat and pit pixels can be displayed by selecting 'Flats and Pits' in the Layer Controller. As shown in the image below, many flat and pit pixels have been created, most at the top of hill crests where the interpolation algorithm has found the same elevation value in all directions due to the final 'ring' contour and has consequently flattened off the hill crest. Don't worry, there is an algorithm to fix this problem and ensure smooth drainage paths over all sides of each hill.
Two algorithms have been introduced into CatchmentSIM to help remove flat and pit pixels from a Digital Elevation Model. Firstly, an iterative filling algorithm has been incorporated to treat the aforementioned hill-crest anomalies and other simple cases where flat and pit pixels have been created by interpolation in areas of low relief or low contour definition. Secondly, a more advanced breaching algorithm has been incorporated to find outlets for any remaining flat or pit pixels. The breaching algorithm can resolve any flat or pit pixel provided there is a pixel with a lower elevation somewhere in the DEM. The algorithm finds the best solution based on a priority function and determines a flow-path from each flat or pit pixel to a nearby outlet and lowers all pixels along this path to form a linear downslope flow-path. The downslope flow-path is optimised by the priority function to traverse the lowest possible pass and have the shortest possible flow length.
The filling and breaching algorithms can be applied to the project automatically without user intervention by selecting DEM Conditioning >> Auto Flat / Pit Removal. However, we will apply each algorithm separately to visualise the effect of each algorithm on the DEM.
In the case of a CatchmentSIM interpolated DEM (as distinct from an imported DEM) it is important to first treat hill-crest flat areas with the iterative filling technique before using the breaching algorithm. This algorithm firstly, raises pit pixels to the elevation of their lowest neighbour, which converts them into a flat pixel and secondly, all flat pixels are raised by a set increment. This is an iterative procedure that will gradually remove flat and pit pixels and raise hill crests in a smooth manner ensuring that the centre of the hill crest will have the highest elevation.
To do this select DEM Conditioning >> Filling Algorithm. The form will display the current number of flat and pit pixels. The filling increment can be edited in the Top Right corner of the form. You can undertake one iteration of the filling algorithm by selecting Process Next Iteration, do this now. You should see that a significant proportion of the flat and pit pixels have been removed and the list on the right will display the largest filling increments that were applied. Don't be alarmed if some of these numbers are large as they represent the occasional deep pit pixel anomaly. To speed up the process select Auto Process and keep watch of the number of pits and flats and largest fill increments as they progress. Once the flat pixel count is down to a satisfactory level (1000 for this tutorial) stop the Auto Process. Remember, most flat or pit pixels are outside of your catchment on the sides on the DEM where they will not effect the project. Furthermore, you can always come back and repair more flat and pit pixels.
For this tutorial, anything less than 1000 flat pixels should be satisfactory. Press Save Changes.
If you now redraw the screen (F2) and re-map the flat and pit pixels you will notice that the flat areas at the hill-crest have been removed. However, some flat and pit pixels within the expected catchment have not been removed. This is due to their position in areas of limited contour information. These flat and pit pixels could have been avoided by inserting Interpolation Training Lines in these areas prior to interpolation. However, they can also easily be treated by applying the breaching algorithm. Select DEM Conditioning >> Breaching Algorithm. A dialog box will appear containing the default parameters for the breaching algorithm. Adopt the default parameters and click the 'Process Entire DEM' button to apply the breaching algorithm to the entire DEM.
After completion of this algorithm you should notice that the flat and pit pixels have been mapped to an optimised downslope outlet pixel and this is indicated on screen by a yellow line. Pixel elevations along this line have been linearly lowered to provide a downslope flow-path for the original flat or pit pixel. If you redraw the screen (F2) and re-map flat and pit pixels you should now notice that none exist within the expected catchment boundary.
CATCHMENT DELINEATION
At this stage your DEM should be ready for use in delineating the catchment. To test flow routing on the DEM try mapping flow from a selection of pixels within the catchment. Do this by selecting Flow Mapping >> Map Pixel Flow Path and clicking on some points on the screen that you expect to be within your catchment. As shown in the diagram below, you should see the downslope flow path of these pixels mapped until they reach a DEM boundary or a flat or depression pixel. Provided they continue past the point where you plan to put your catchment outlet, catchment delineation should work.
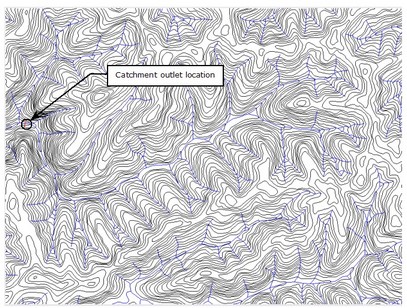
Identify your catchment outlet by drawing a short line where you wish to place your catchment outlet, do this by selecting Subcatchments >> Draw Outlet from the menu and clicking on the screen. Click once to start the line, then click on additional vertexes. Finally, right click to end the line and save the outlet pixels. For this tutorial, place the catchment outlet line in the position shown below.
Despite drawing a line to identify your catchment outlet, the outlet is actually recorded as a group of pixels. Display of the outlet pixels can be toggled in the View Attributes form.
You can now identify subcatchment outlet points if you wish but in this case we will first delineate the entire catchment, do this by selecting Subcatchments >> Map All. This is the most time-consuming algorithm in the program as it is effectively drawing flow path maps for every pixel in the DEM and recording which ones flow through the pixels you have designated as your catchment outlet.
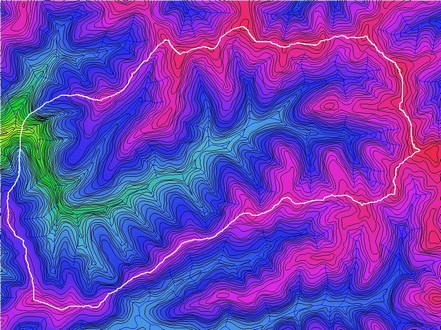
Following completion of the flow processing, the catchment boundary should appear as shown below (try changing the line colour/thickness or turning off the DEM background using the Layer Controller if you are having trouble seeing it). Problems with any flat or pit pixels within the catchment will become obvious at this stage and should appear as holes in the catchment. Furthermore, any areas that could benefit from the placement of ITLs will become apparent.
SUBCATCHMENT DELINEATION
Catchment partitioning is the process of breaking up a catchment into a network of subcatchments with joining links. Subcatchments are identified by their outlet pixels similarly to the catchment outlet. This can be done manually (as for the catchment) or by taking advantage of CatchmentSIM's automatic catchment partitioning algorithm.
For this tutorial, we will be using the automatic catchment partitioning algorithm by selecting Subcatchments >> Breakup Subcatchment. The subcatchment you wish to partition is number 1 (since you only have one subcatchment delineated) but you can also identify the subcatchment to partition by pressing 'From DEM' and selecting the subcatchment by clicking on it (the subcatchment should be highlighted when the mouse is positioned over it).
The catchment is currently delineated into 1 region but we want to partition it into several subcatchments. This can be achieved using one of three available techniques. Either subcatchment outlets can be identified at the largest jumps in flow accumulation values (designed to break the catchment into similar size subcatchments), subcatchment outlets can be identified at junctions in the predicted stream network of particular Horton stream orders (see Vector Stream Network below) or subcatchments can be identified based on a specified subcatchment area. For this example we will use the second option.
The Horton Order based catchment breakup algorithm aims to delineate subcatchments of a particular Horton order based on the vector stream network. The algorithm aims to place a subcatchment outlet pixel above and below the lateral inflow corresponding to a tributary that is greater than the selected threshold Horton order. For example, if a user wishes to delineate all 3rd order subcatchments or higher then a dual outlet will be placed wherever two 3rd order (or higher) vector stream segments intersect such as a 3rd and 4th order intersection but not a 3rd and 2nd order intersection. Using this algorithm does not allow the user to designate the exact number of new subcatchments, however, reducing the order delineation threshold will increase the number of dual outlets in the table and thus the number of subcatchments.
For this tutorial, we will delineate subcatchments with a Horton Stream Order of 2 or higher. Select the 'Process Subcatchment' button. A dialog box will appear prompting you to input the Stream Area Threshold (SAT) as well as a Minimum Source Channel Length (MSCL). The SAT value refers to the number of pixel's flow paths that must accumulate in a single pixel before it will be considered a potential channel head. The MSCL parameter defines how long a stream segment must be to be considered valid. Input a SAT value of 500 pixels and DO NOT apply the MSCL to this example.
The list towards the bottom of the form should now be filled with several lines of data, sixteen in this case. These are the lateral inflow junctions that have been identified to serve as the locations for subcatchment outlets. You should take a quick look at these numbers to ensure that the same junction hasn't been picked up twice and the lateral inflow quantities are significant enough to warrant subcatchment delineation. If you wish, you can remove a lateral inflow junction using the Delete Lateral Inflow button (this will reduce the resulting number of subcatchments by two). For this tutorial, this should not be necessary. Click Accept New Subcatchments.
CatchmentSIM will prompt you to decide if you wish to refine this subcatchment now or wait until later. If you select yes then the program will initiate Flow Processing for only those pixels within the catchment. However, in some cases you may wish to select no, identify further subcatchments by hand or automatically partition other subcatchments and then redo DEM Wide Flow Processing at a later time. For this tutorial, select yes.
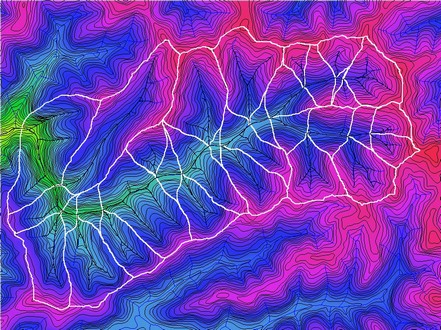
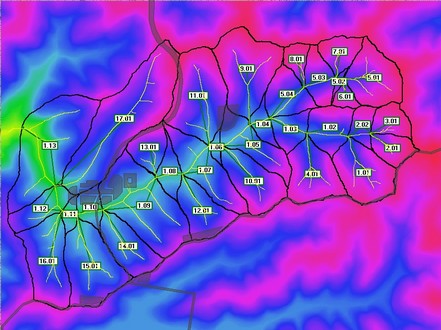
After this process is complete, you should see that the catchment has been partitioned into the designated number of subcatchments (refer image below). At this stage, you can add additional subcatchments, delete existing subcatchments or automatically partition other subcatchments.
network arrangement
The subcatchments are automatically arranged in a hydrologic network arrangement. To view this select Nodal Link Arrangement in the Layer Controller form. The subcatchments are labelled, and subcatchment links drawn, in accordance with the options selected in the Project Options form. The nodal link arrangement for the tutorial is shown below.
display of external gis layers
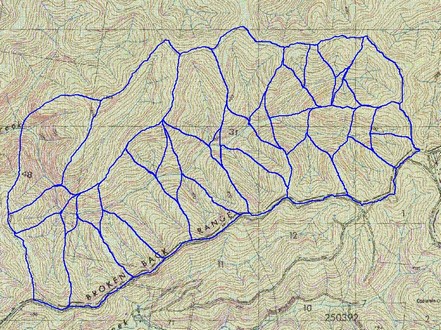
CatchmentSIM supports display of many other vector or raster GIS layers. Examples of this may include displaying a Mid/Mif or ESRI shape file containing road networks or other infrastructure on the screen (using the Add button in the Layer Controller) or insertion of a scanned topographic image (using the Add button in the Layer Controller and altering the file type filter). A scanned topographic image has been included in the GIS sample data for this purpose. To add this image to your project selected the Add button in the Raster Layers section of the View Attributes Form and select the tut-topo.jpg image. Using the 3 Image Corner Coordinates referencing standard enter the following coordinates for the image extents:
Xmin: 321237.54
Ymin: 6365851.936
Xmax: 327261.499
By turning off the contour and stream layers in the View Attributes form you will be better able to see the subcatchment boundaries superimposed over the scanned topographic image (refer image below).
If the coordinates of the raster image extents are unknown then the image can be positioned by clicking a rectangle on screen using the Drag and Drop Image On Screen button and then geo-referenced by identifying points on the image and drawing arrows to their corresponding real location using the Move Image By 2 Point Dragging button.
impervious areas
CatchmentSIM also provides a function for users to import polygons that represent impervious or partially impervious areas into a project. Alternatively, these can be drawn directly onto the screen using the GIS >> Draw Object >> Draw Impervious Area option. CatchmentSIM will accept any type of normal or complex polygon (such as 'island' polygons, polygons with holes and concave polygons) and will automatically calculate the impervious proportion for each subcatchment.
For this tutorial, a sample data-set of impervious areas has been included with the GIS data. Select the GIS >> Impervious Areas menu and then select Import Polygon(s). Locate and select the file impervious-areas.mif. A dialog box will then require you to identify data columns in the GIS data-set that correspond to the polygon description and impervious proportion fields. These can be assigned to 'None' and entered manually at a later stage, however, this sample data-set includes these attributes. For the polygon description field select the 'Description Char(50)' data column and for the Impervious Proportion field select the 'Impervious_% Float' data column and then press OK. CatchmentSIM will then import the polygons and update the form's grid accordingly.
From the Impervious Areas form a user can turn polygons on or off and edit their description or impervious proportion attributes. This can be done for single polygons or multiple polygons by using the control or shift keys or the group selection functions. It should also be noted that the polygons will be highlighted in red on the main form in the background when they are selected. The form also includes a filter function and options that dictate the background impervious proportion and control how any overlapping polygons are treated.
The simplest method of turning polygons on and off is by clicking the associated checkbox, however, this may be done spatially by selecting the Toggle On / Off Over Display button. This will allow a user to turn polygons off and on by simply clicking on them, active polygons will be shown in black while inactive polygons are shown in light grey.
Once you have finished experimenting with these functions, press OK. The impervious areas will then be displayed on the screen and the calculated impervious proportions for each subcatchment will be listed in the Subcatchment Manager form (see below).
hydrologic analysis
At this stage, you are ready to export the resultant quasi-distributed hydrologic model to a back-end application or export project layers to a GIS application, but there are many other tools in CatchmentSIM which you may like to apply to the catchment beforehand. A range of hydrologic analysis tools are available to assist with gaining a quantitative understanding of the hydrologic properties of the various subcatchments or the catchment as a whole. These include customisable graphs, calculation of common hydrologic properties such as drainage density or bifurcation ratio and dynamic parameter variance animations.
To begin with, a range of available parameters for the subcatchments can be viewed in the Subcatchment Manager form. This can be accessed from the Subcatchments >> Subcatchment Manager menu and clicking on the relevant subcatchment (it will highlight as you scroll the mouse over it). Some other hydrologic analysis tools are described below:
Vector Stream Network
CatchmentSIM offers a powerful and hydrologically accurate form of stream network prediction by defining a vector stream network. This is achieved by identifying potential channel heads using the Stream Area Threshold and then generating an intersecting polyline stream network by routing flow from these pixels to the catchment outlet. During this process, CatchmentSIM will determine alignments, lengths and stream order values for each predicted stream segment.
This function can be activated by selecting Flow Mapping >> Generate Streams. The display of this layer can be customised from the View Attributes Form by selecting the Synthetic Streams row and clicking Properties. This will generate a form which will allow you to set a colour, width and line type for different stream order values.
Generating the vector stream network will also allow for determination of Horton drainage density values and Bifurcation ratio values which are displayed in the Subcatchment Manager Form. As outlined previously, vector stream networks can also be used as the basis for automatic catchment breakup.
charting
CatchmentSIM includes a range of graphical analysis tools, which can be accessed through the Analysis >> Graph Wizard menu. These include
•Longitudinal downslope profile for any pixel (including superimposed average vectored slope).
•In-stream pixel proportion vs overland flow distance.
•Raster drainage density vs Stream Area Threshold (SAT).
•Bifurcation ratio (Log (number of streams) vs stream order).
•Cumulative Stream Length vs Stream Order (log / log).
•Hypsometric Curve (relative height vs relative area)
GIS Export
CatchmentSIM allows export of most project data (visual and tabular) to external GIS applications. This function can be accessed through the 'Export >> Export to GIS' menu option. The following screens will allow you to select which data layers you would like to export and which tabular data you would like to attach to the visual GIS data. CatchmentSIM will then write the GIS data files to enable direct import of this information into another GIS application. By default, CatchmentSIM will export the data in the same projection as your project. However, you can re-project the data into an alternative projection by clicking on the Change Projection checkbox and button. This is recommended if you are using a custom projection that is unlikely to be supported in another GIS application.
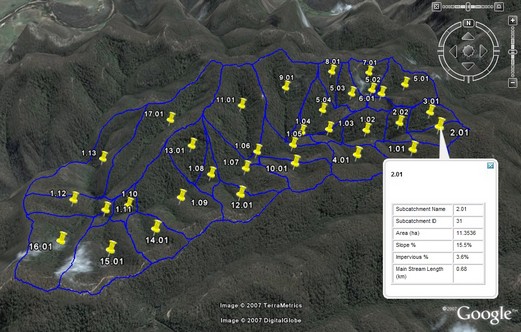
CatchmentSIM can also export most project data to third party applications, including Google Earth. To export the tutorial project to Google Earth, select 'Export >> Google Earth'. A form will appear asking you which of the available data sets you would like to export. Select the 'Subcatchment Boundaries' check box. Ensure that the 'Launch Google Earth' check box is also selected and click OK. A 'Save As...' will appear prompting you to specify the same and location of the Google Earth KML file that will be generated by CacthmentSIM and opened in Google Earth. Specify a file name and select save.
Google Earth should automatically open and the KML file containing the previously selected CatchmentSIM layers will be displayed (refer below). Please note that Google Earth requires an internet connection in order to function.
A 'pushpin' will be displayed at the centroid of each subcatchment. The 'pushpin' can be selected and the associated properties of the subcatchment will be displayed as shown above.
HYDROLOGIC MODEL INTEGRATION (ADD ON MODULE)
CatchmentSIM provides a powerful add on module for extracting results and parameters from projects. A flexible macro language is built into the software to allow generation of text or binary files in any desired format. This means CatchmentSIM can be tailored to provide input files for any other hydrologic model. The macro language reads macro templates that can be distributed with the program, downloaded off the web or written by a user. To write your own export macro scripts refer to the CatchmentSIM CSTalk Macro Reference Guide.
To integrate your tutorial project with a supported modelling system, select Export >> Macro Wizard. The default path for the macro scripts is indicated in the top left box and any subdirectories may be accessed through this control. The box to the right lists the macro scripts available in the selected directory. Information on each macro script will appear in the bottom box after clicking on a script file.
Select the macro file that corresponds to the desired back-end hydrologic model and click Run Macro. After answering any questions the script may generate, you should find that CatchmentSIM has created the file(s) required for integration with the back-end model. For example, in the case of a HEC-HMS export, CatchmentSIM will automatically create 3 files (.hms .basin & .map) which can be then opened up directly from the HEC-HMS software.
conclusions
This tutorial has aimed to give you an introduction to the features of CatchmentSIM. Please feel free to experiment with the many other tools within the program and remember to check the website for software updates.
You may also wish to undertake the Intermediate and Advanced CatchmentSIM training courses which cover all aspects of CatchmentSIM including sample projects, video demonstrations, interactive presentations, self-assessment, discussion forums and certification on completion.
Feedback, ideas and questions are always appreciated and can be submitted via the website or user forums.
