The rainfall analyser is a powerful tool that can be used to process large amounts of rainfall data to make it suitable for use in third party and hydrologic software. In this extension of Tutorial 1, we will initially find nearby rainfall gauges to decide which gauges we would like rainfall data for. We will then import the rainfall data into the rainfall analyser and select an historic rainfall event to analyse. We will then use the Rainfall Analyser to view the spatial and temporal distribution of the rainfall over the event being analysed. The outputs from this analysis can then be exported from CatchmentSIM in CSV format and/or exported directly to third party hydrologic programs (requires Macro Language module). We will also create an animation/video to show how the rainfall varied spatially and temporally during the historic event.
To start this tutorial, open the "Tutorial1.smr" CatchmentSIM project. This can be downloaded from here.
1.Find Nearby Rainfall Gauges
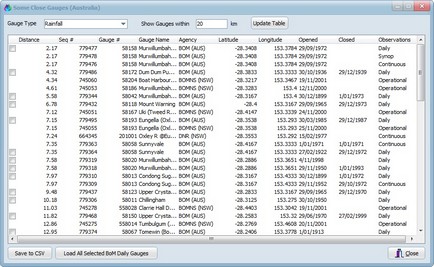
To gain an idea of the gauges that are located close to your catchment and the period of record of those gauges, we can use the Analysis >> Find Nearby Gauges tool. You can select what type of gauge you’re looking for (i.e., rain or stream gauge and a search distance from the centroid of your catchment. We will select 'Rainfall' as the gauge type and '20'km for the search distance. Now click ‘Update Table’. All rainfall gauges within the search distance are shown, as well as their hydrologic properties parameters (e.g., distance from catchment centroid, gauge number, gauge name, agency, latitude, longitude, opening and closing date, observation type).
All gauges displayed in the table will also be shown graphically in the main CatchmentSIM window as a series of blue dots. The location of specific gauges can be visualised by clicking on a row in the table. The resulting gauge location will be shown as a larger red dot.
From this point we have two options to obtain rainfall data for each gauge:
1.Save the table to a CSV file and use this table as a basis for selecting which gauge data to order and/or download (e.g., from the Bureau of Meteorology)
2.Automatically download daily rainfall data from the Bureau of Meteorology website.
If you would like to proceed with the first option, skip ahead to Step 2. If you would like to proceed with the second option, read on...
To take advantage of the automatic download facility, place a "check" next to each gauge in the table (i.e., only data for "checked" gauges will be downloaded). Currently, only daily data can be automatically downloaded. Therefore, check boxes won't be available next to continuous or synoptic gauges. Once all the check boxes have been selected, press the  button.
CatchmentSIM will start to download data for each of the selected gauges from the Bureau of Meteorology website and will then import it into the Rainfall Analyser. It is important to have a strong internet connection when attempting to use the automatic download facility - any interruptions to the connection will cause the download/import procedure to fail.
2.Importing data into the Rainfall Analyser
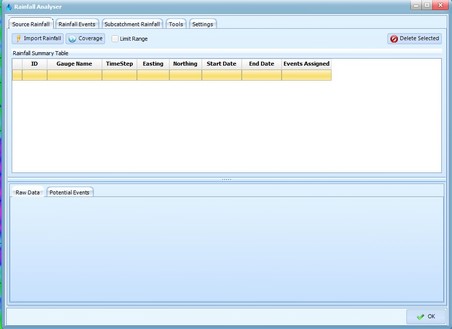
If you have used the automatic download feature, the Rainfall Analyser should already be opened and the daily data imported. If you did not use the automatic download facility you will need to open the Rainfall Analyser by selecting Analysis >> Rainfall Analyser.
If the daily rainfall data was not automatically imported, we will need to import it manually. Click on ‘Import Rainfall’ and an open dialog will appear. Navigate to the "Data / Rainfall Gauges" folder. Select all of the *.csv files except for the ‘Pluvio_2001.csv' and click Open.
You should see the gauges progressively being processed and added to the time series summary table. A range of hydrologic parameters will also be added to the summary table including the data time step, starting and ending date, location (in the project projection), gauge name and gauge number.
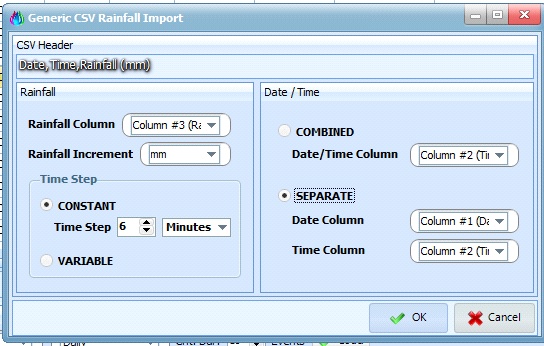
In addition to the daily gauge data imported above, we have a pluviometer (i.e., rainfall records at 6 minute intervals) in the vicinity of our catchment. This particular data is in a generic CSV format. To add this data to the Rainfall Analyser, click ‘Import Rainfall’, then select the ‘Pluvio_2001.csv’ file. Ensure the 'File of Type' filter is set to ‘Generic CSV File’ and click 'Open'. You will be prompted with a dialog asking if you would like to process a header for the CSV file. This particular CSV file has a header, so we will select ‘Yes’. We now have the option of selecting the column that contains the Rainfall, the rainfall units, the time-step of the data, and the date and time columns. Select Column #3 (rainfall) for the Rainfall Column, the Rainfall Increment as 'mm', the time-step as constant at 6 minutes, select the ‘separate’ radio button for the date/time, and then select Column #1 (Date) for the Date, and Column #2 (Time) for the Time Column, as shown below.
We are now prompted with a dialog asking if we would like to manually assign the coordinates of the gauge (as the CSV does not contain any positional information). Select 'Yes'. We now have the option of entering the coordinates in latitude/longitude, the project projection, or any other supported projection. Select the ‘Project Coordinates’ radio button and enter an Easting of '525874', and a Northing of '6858930'. Click 'OK'.
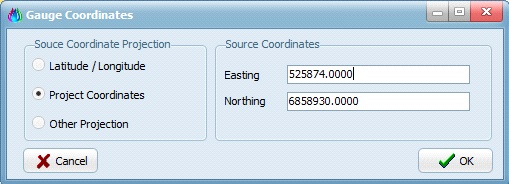
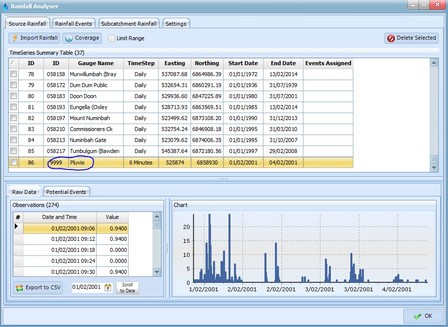
You will now see that the gauge has been added to the time series summary table. The gauge number and name are currently generic. They can be manually updated directly in the summary table. We will change the ID to 9999, and Name to “Pluvio”.
3.identifying Rainfall Events for analysis
To view the data for a selected gauge, click on the gauge in the summary table and the raw data and a chart of the raw data will be displayed near the bottom of the window. The chart can be useful for identifying when significant rainfall events have occurred.
Significant events can also be identified with the assistance of the 'Potential Events' tab (located to the right of the 'Raw Data' tab). You need to select a specific gauge to form the basis for the analysis. In this case, we will select ‘058158 (Murwillumbah (Bray Park))’, select ‘Daily’ from the Critical Duration drop down, and leave the Events set as '10'. Now click ‘Load’. The program will search through all of the raw data and identify the 10 largest daily rainfall totals over the period of record for that gauge. This analysis should show the largest daily rainfall total occurred in 1978, followed by 2001.
As our pluvio gauge only has data for 2001 (as shown in the time-series summary table), we will choose the 2001 event by clicking on the appropriate row in the table, as shown below. You should notice that the start and end dates on the right side of the table update for the 2001 event (this includes a suggested start and end date for the event). Click ‘Setup Event’.

4.Setting up an historic rainfall event
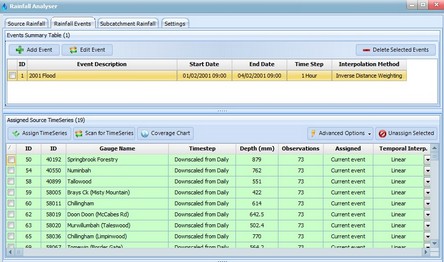
You will notice that after clicking on ‘Setup Event’ that the 'Rainfall Events' tab is opened, and the start and end dates/times are populated (alternatively, you could select the 'Rainfall Events' tab and then the 'Add Event' button). Give the event a suitable name (e.g., '2001 Flood') and select an appropriate time step. In this case, we will adopt a 1 hour time step (all other default options can be retained). Click ‘Accept’.
CatchmentSIM will search through the available gauge data to determine which gauges were active during the event, which will be displayed in the 'Assigned Source Time Series' Table. A range of additional data will also be displayed in the table including the time step of the raw gauge data, the total depth of rain that was recorded at the gauge during the event and the number of data points (i.e., observations) at the gauge during the event.
You now need to decide which of these gauges you would like to use to "define" the event. By default, all of the available gauges will have a 'tick' next to them, indicating that all gauges will be used in the analysis. In this case, the "58183 Doon Doon (Doughboy Mountain) " gauge comprises a significantly lower event depth relative to all of the other gauges (click the "Depth (mm)" column header to sort the gauges by rainfall depth). This may indicate that the recorded rainfall for this gauge may not be reliable. Therefore, we we will remove this gauge from the analysis by "un-checking" the check box next to this gauge. The remainder of the gauges can remain checked. Now select ‘Assign Time-series’. This will assign all checked gauges to the event (i.e., all gauges except for the "Doon Doon (Doughboy Mountain)" gauge). All assigned gauged will be displayed in green, while unassigned gauges will be displayed in yellow.
5.disaggregating data to a finer time scale
As the majority of our gauges are daily, the raw rainfall data does not describe the temporal variation rainfall at a sub-daily time scale. Therefore, we need to disaggregate the daily rainfall data down to the desired 1 hour time step. Three options are available for the disaggregation of daily data to a sub-daily time step (referred to as Temporal Interpolation). For this project, we will use the pluviometer to define the temporal distribution of rainfall during the 2001 event. To do this, we will use the ‘Advanced Options’ menu, and select ‘Apply all gauge patterns with nearest temporally finer gauge’. This algorithm will search for all gauges with a time step equal to or less than the event time step. It will then assign this temporal pattern to the closest daily gauge (based on the straight line distance). In this case, we only have 1 pluviometer, so the temporal pattern from this pluviometer will be applied to all of the daily gauges.

You should notice the "Temporal Interp." column for each gauge gets updated to "Gauge Pattern" and the "Interp. Basis" gets updated to "ID_9999_(Pluvio)" to indicate that the rainfall data for each daily gauge has been down-sampled based on the temporal pattern provided by the "Pluvio" gauge. You should also notice that the 'Resampled values' table and Cumulative Rainfall / Hyetograph charts modify to reflect the new temporal definition provided by the Pluvio gauge.

6.Defining a Rainfall Hyetograph for Each Subcatchment
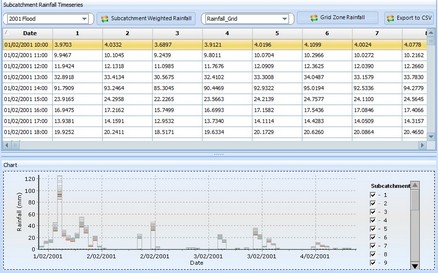
We will now calculate unique rainfall hyetographs for the 2001 event for each subcatchment based on the available gauge data. Select the 'Subcatchment Rainfall' tab and then select the desired event from the drop down menu (the '2001 Flood' should be selected by default) and finally select the 'Subcatchment Weighted Rainfall' button.
CatchmentSIM will calculate a weighted average rainfall depth for each subcatchment for each time step based on consideration of rainfall depths across all DEM grid cells within the subcatchment (the rainfall depths for each grid cell are interpolated for each time step using the spatial interpolation approach defined on the 'Rainfall Events' tab).
Once the weighted average rainfall depths are calculated for each subcatchment and each time step, they will be displayed in tabular as well as chart form. Each subcatchment is represented as a separate column in the table.
Now click OK to return to the main CatchmentSIM window.
7.Create an isohyet map / Animation
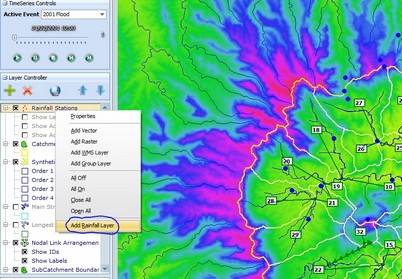
We will now create an isohyet map / animation to show how the rainfall varied temporally and spatially during the 2001 event. To add a rainfall layer to your project, right click in the layer controller and select ‘Add Rainfall Layer’.
On the resulting dialog, use the following settings to define the isohyet contour interval and time step:
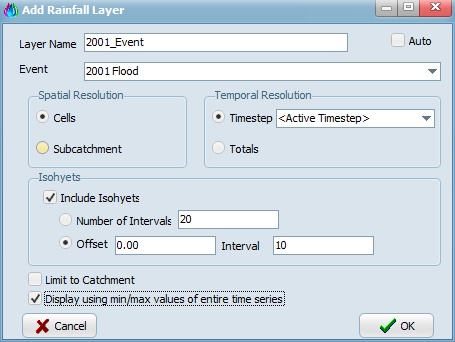
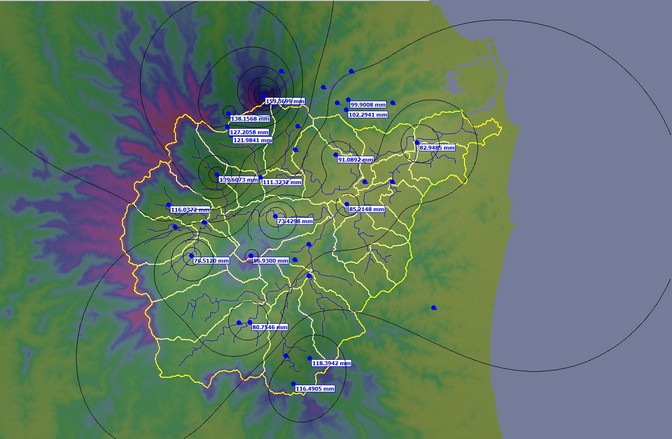
You should see isohyets and a rainfall depth grid layer for the first time-step of the analysed event. To view the rainfall depths for this time step at each gauge, check the 'Show Active Totals' check box under the 'Rainfall Stations' layer:

To "step through" the event, use the  buttons or the slider bar in the Time Series Controls (located above the Layer Controller). Alternatively, you can press the
  button and allow CatchmentSIM to step through the time-steps for you. You can export any of the isohyet maps at a particular time step by "pausing" the animation and selecting "Export >> Export Display", as shown below.
We can also create an AVI movie to show the spatial and temporal distribution of rainfall over our catchment. To do this, select Analysis >> Create Animation. We can then choose the appropriate event, how long we want each frame to display and the range of frames we want included. In this example, we will leave the defaults and click OK. Select a save location and the AVI will be created. You should be able to see the project updating as CatchmentSIM steps through each of the frames. You can then open the created *.AVI file to view the created animation.
You can also export the rainfall hyetographs for each subcatchment (as defined on the 'Subcatchment Rainfall' tab of the Rainfall Analyser) to third party hydrologic software (using the Macro Wizard). Export scripts are available for:
•XP-RAFTS
•RORB
•URBS
