The graph wizard form provides access to a range of charts which are described individually in the following sections. However in general, first select the type of chart required from the tabs, either flowline profile, cross-section profile or subcatchment analysis. The subcatchment analysis chart includes a dropdown box further specifying the type of chart required. At this point, add the pixels (flowline profile), cross-sections (cross-section profile) or subcatchments (subcatchment chart) for analysis. This can be done visually or manually. In the case of the subcatchment analysis charts, select the Single Sub(s) From DEM button and manually click on as many subcatchment as desired (they will highlight when the cursor is over them) and then click Finished. You will find that the integer code associated with the subcatchments has been added to the list box. Alternatively, there are buttons to manually add single subcatchments by typing them in, adding the catchment as a whole, adding all subcatchments or adding subcatchments with/without upstream inputs.
When the pixels, cross-section or subcatchment to analyse have been selected, press Generate Chart to process the graphing. The resultant graph can be edited using the Edit Chart Attributes button and zoomed by clicking and dragging on the graph window. The charts can be printed using the Print Chart button or copied to the clipboard for pasting into your preferred application. The charts can also be exported to a Comma Separated Variable (CSV) file for further analysis in spreadsheet applications.
The subcatchment analysis charts are designed to be used in combination to interrogate subcatchment parameters and gain a better understanding of their hydrologic characteristics.
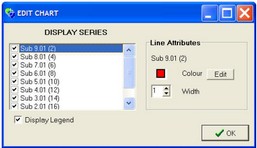
The edit chart form can be used to edit the colour, width and visibility status of currently displayed series the Chart form. There is also an option governing the display status of the legend.
Specific information on each chart follows:
