Overview
Monte Carlo analysis in hydrology uses stochastic sampling of key parameters including rainfall, loss rates, temporal patterns and others to create a large number of storms. The results from these storms (such as peak flow at the outlet) are then analysed using statistical methods to create a frequency distribution which allows the estimation of the result for various excedance probabilities (AEPs). Key components of the Monte Carlo approach in Storm Injector are:
•The full range of excedance probabilities are estimated at the same time
•Other variables (such as storage starting water levels) can also be sampled from their distributions
•Frequency distributions can be determined for many measures including peak flow, volume, time to peak and storage metrics
•Representative events can be extracted from the storm series that produce results that are near the AEPs of interest for use in hydraulic modelling
•The method typically requires IFD data from the BoM frequent to rare datasets (12EY to 1 in 2000) but can benefits from even rarer rainfall estimates (such as those produced by Extreme Event IFD PMP Interpolation)
•A stratified sampling approach is used to ensure the storm series includes rare flood producing rainfall.
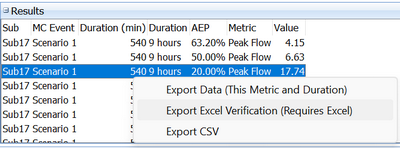
•An Excel based verification worksheet can be produced to verify results manually
•For performance reasons, the result files for members of the storm series are deleted immediately after extraction of key results. Representative events can be re-run on demand to extract hydrographs and other information.
•Due to a number of optimisations, the Monte Carlo approach can be considerably quicker than the ensemble approach when considering a range of AEPs, particularly for WBNM and WBNM Internal.
•Further information can be found in ARR (Book 4, Section 4.3), the ARR Monte Carlo discussion paper and our FMA 2025 conference paper.
First Steps
Before starting with the Monte Carlo tab, the user should have undertaken preliminary steps on the Storm Generator and Model Runs tab, including:
•Import the model into the Project Setup panel (Button 1)
•Download Data Hub Information (Button 2)
•Download Standard IFD Rainfall Locations and spatially weight if necessary (Button 3)
•Download Frequent and Rare versions of all IFD Locations (Button 3)
•Select at least one event and Create Storms (Button 4)
•Check the Routing Increments panel
•You may wish to proceed with Buttons 5 onwards to create ensemble results for a range of events as these can be used as comparisons for the Monte Carlo frequency results
Configuring Scenarios
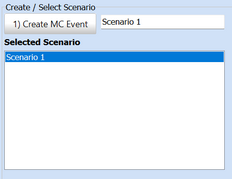
A scenario is particular configuration including storm series for a range of burst durations. A scenario will give results for a wide range of AEPs and can easily be compared to other scenarios. Similar to the prefix functionality in the ensemble approach, scenarios can be used with different (yet complimentary) model files to compare differences.To create a scenario, click 1) Create MC Event. The scenario should have a unique name which can be entered in the text box.
Once a scenario, is selected, the tabs in the Customise Scenario section should be available. Scenarios can be renamed and deleted via right click.
The tabs in the Customise Scenario section often do not need any changes but will be described in the following sections.
Rainfall
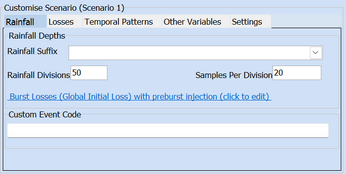
The rainfall tab shows default settings for the stratified rainfall sampling. A default of 50 rainfall divisions and 20 samples per division will create a storm series with 1,000 members. The rainfall will be sampled from the IFD Locations associated with the subareas on the Storm Generator Project Setup panel.
Custom code can be entered for rainfall adjustments such as climate change code. The Monte Carlo climate change code can be generated by right click on the prefered temperature forecast cell in the Climate Change panel on the Storm Generator Tab. After right click, the code will be generated and inserted in to the Custom Event Code field.
Rainfall Losses
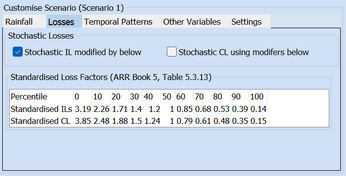
Rainfall loss rates are based on the same settings as per the ensemble approach (previewed in the Burst Losses panel on the Storm Generator tab) but modifier factors can be applied based on the standardised loss factors in ARR Book 5, Table 5.3.13. This allows for the inherent uncertainty of antecedent conditions to be represented within the storm series while preserving the average loss rates as per ARR guidance.
By default, these loss modifiers are applied for initial loss but not continuing loss due to concerns that IL and CL are not independent variables for the purposes of statistical sampling.
Temporal Patterns
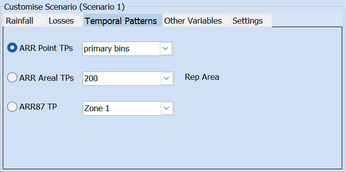
Temporal patterns will be randomly assigned from the applicable temporal pattern set based on the rarity of the event (frequent, intermediate, rare for Point TP), duration and region. Alternatively, for Areal TPs, the TP set is defined by the representative area.
For Point and Areal temporal patterns, this will effectively mean one of the 10 applicable ensemble patterns will be randomly applied for each member of the storm series.
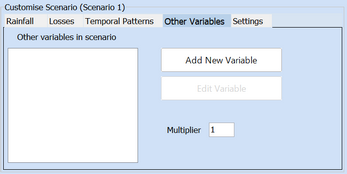
The Other Variables tab allows for the injection of transformed stochastic values for other variables (such as starting water levels in storages) are discussed later in this page and in this tutorial.
Seeds
By default, all scenarios use new stochastic number series for sampling of all variables including rainfall, IL, CL (if selected), Temporal Patterns and Other Variables. However, if you wish to remove any stochastic influence when comparing two scenarios, you can link the stochastic seeds from the 2nd scenario to the first. This is particularly useful when scenarios are using different (but compatible) models and you wish to examine changes, such as pre vs post analysis.
Settings
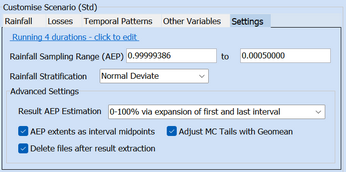
The Settings tab gives some settings for the scenario which should not typically require any changes including:
•Rainfall Sampling Range
These are the extents of the rainfall available fro the IFD Locations and should not require changes.
•Rainfall Stratification
Normal Deviate rainfall stratification is the default option but Gumbel can also be used.
•Delete files after processing
By default, result files from members of the storm series are deleted immediately after result extraction. It is not recommended to turn this off.
Running Models
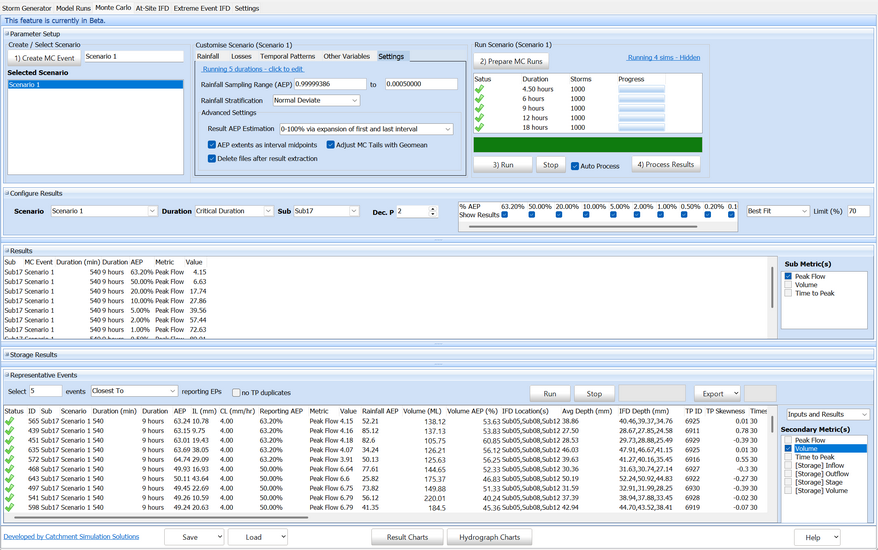
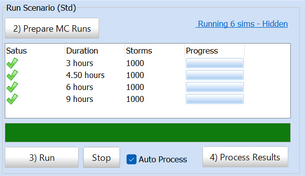
Click 2) Prepare MC Runs to select a model file (similar to Button 5) Prepare Model Runs for the ensemble approach) and generate the Monte Carlo storm series. The Monte Carlo approach still uses a critical duration approach and there will typically be a 1,000 member storm series generated for each duration selected in the Durations tab in the Selected Events panel on the Storm Generator tab.
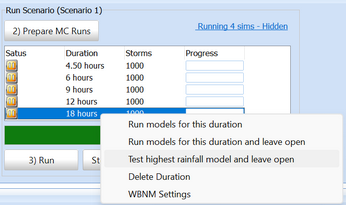
The next step is to run all models which will be done in a multi-threaded capacity (one duration per PC core) based on the number of Sim Runs selected in the Model Runs tab (near Button 6). However, since Monte Carlo will apply extremes of parameters including rainfall, it is a good idea to test the model first. Right click on a given duration and select Test highest rainfall model and leave open. This allows you to test the model with the highest rainfall estimates and ensure it runs. If not, it may be exceeding storage curves or other model parameters and the console window or files generated may be used to help debug the model. If the model requires modifications, repeat Button 2) Prepare MC Runs with the updated model file.
When confident that the model is robust, click 3) Run.
Processing Results
The results should auto process, but if not, click 4) Process Results.
The Configure Result panel governs the results that will be displayed in the various tabular outputs and charts. AEPs of interest can be turned on/off. There are two other parameters set here including:
•Best Fit or Sample Results: Best Fit uses a polynomial line of best fit between the results to extract AEP estimates whereas Sample Results uses individual results to determine AEP estimates
•Limit (%): The analysis of stratified samples becomes less reliable at the extreme end of the sample. This limit refers to how many samples in the final interval must exceed the estimate before it can be considered reliable. Unreliable estimates are flagged in tabular outputs in red and are not shown in charts by default.
Tabular Outputs
The Results table lists AEP estimates for the Metric(s) selected in the checklist box to the right. This can be customised by the metrics selected and the Configure Results panel settings.
Frequency Distribution Chart
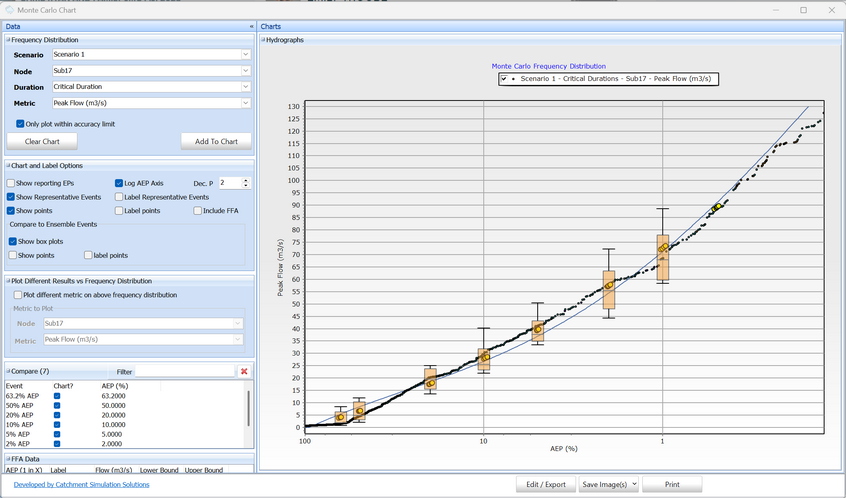
Clicking on the Result Charts button will display the Monte Carlo frequency curve charting form. This allows frequency curves for any metric to be displayed and compared to ensemble box and whisker plots (if available).
Representative Events
Representative events will be automatically selected from the storm series members whose AEPs are similar to the AEPs selected in the Configure Results panel. The 'Inputs and Results' option can be selected above the Secondary Metrics option in order to view a full range of input and output parameters from the representative event including the actual values for all sampled variables.
Secondary metrics can be used to show where on the frequency distribution a representative event may fit for a different metric. For example, a representative event may have a Peak Flow AEP of ~1% but may have a different AEP for its volume. These can be used to help identify which storm members may provide useful hydrographs for hydraulic modelling.
Representative events can be exported to output formats such as *.ts1 using the Export button or right click options.
Hydrograph Charts
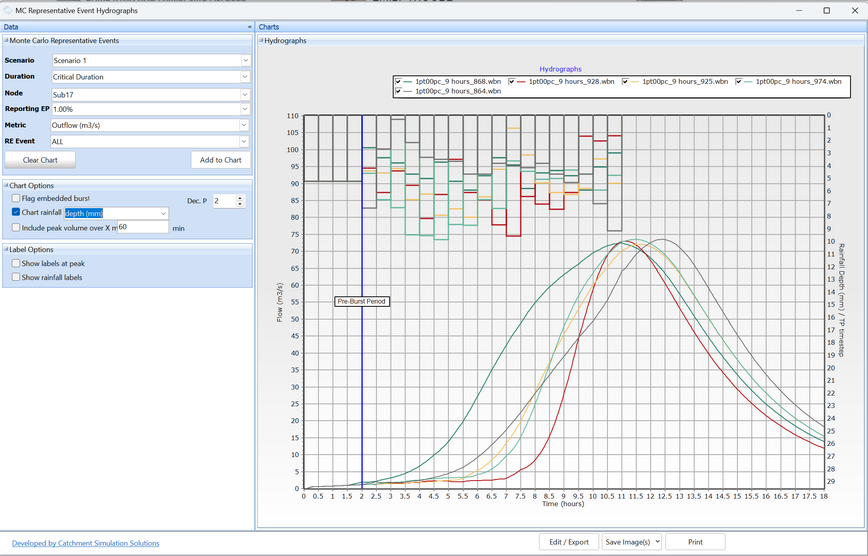
Hydrographs can be displayed for representative events. However, the model needs to be re-run to generate hydrographs and persistent output files. This can be done by configuring the Representative Events table and then clicking Run. Following this, click Hydrograph Charts to display the MC Representative Event Hydrographs form.
A tutorial for Monte Carlo can be seen in this tutorial.
Other Variables
A key advantage of the Monte Carlo approach is that it allows other variables to be sampled from appropriate distributions and applied to members of the storm series in order to evaluate the impact on AEP estimates. This allows the uncertainty in these parameters to be considered without threatening the AEP neutrality of the analysis.
To create an Other Variable, click Add New Variable in the Other Variables tab of Customise Scenario. After creating the variable, it must be turned on for the Scenario being customised using the checkbox. If the amount of variables being sampled means that a larger storm series is required, the multiplier value can be changed. For default settings, a change to 2 will cause the storm series to increase to 2,000.
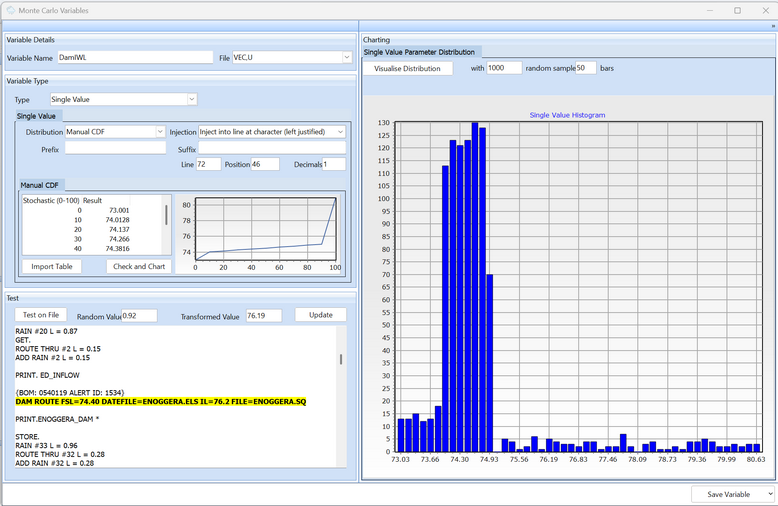
The Monte Carlo Variables form allows variables to be named and their distribution types to be entered. The available distributions includes Uniform, Normal, Beta, Manual CDF and Empirical.
This form also requires information regarding how this variable can be injected into the model file. Currently, only Single Value injection is supported. The injection can be tested on the model file using the Test on File button. It is recommended that further testing is undertake using the testing options in the right click menu for the grid in the Run Scenario section to ensure variable injection is working corrected before running the complete analysis with 3) Run.
Monte Carlo sampling of variables such as initial water levels can be seen in this tutorial.
Excel Verification
Storm Injector uses a stratified sampling approach with analysis based on Total Probability Theorem (TPT) and results can be exported to Excel for manual verification by right click on the Results table. The exported Excel workbook includes the formulas for calculating an AEP for any flow. This feature requires Excel to be installed on the PC and can be slow due to the speed of the Excel API (grab a coffee).
