It is becoming common for flood investigations to require comparison of at-site rainfall data to BOM 2016 IFD data. This criteria is now part of the NSW flood brief development tool and is considered relevant for coastal areas in NSW.
From version 1.1.8, Storm Injector includes tools for analysis of at-site rainfall records in order to compare maximum annual rainfalls at various durations to IFDs downloaded from the BoM via '3) Get IFD Data'. These tools are on the 'At-Site IFD' tab as depicted below.

At-Site IFD Analysis Tab
The first step in an At-Site IFD analysis is importing and analysing the rainfall data. Daily rainfall for Australia can be freely and automatically downloaded using Storm Injector but sub daily rainfall may need to be purchased or downloaded seperately. Storm Injector supports many common formats including:
•BoM 6 min, 1 min and Daily rainfall formats
•MHL Format
•A generic CSV rainfall import routine (currently under development).
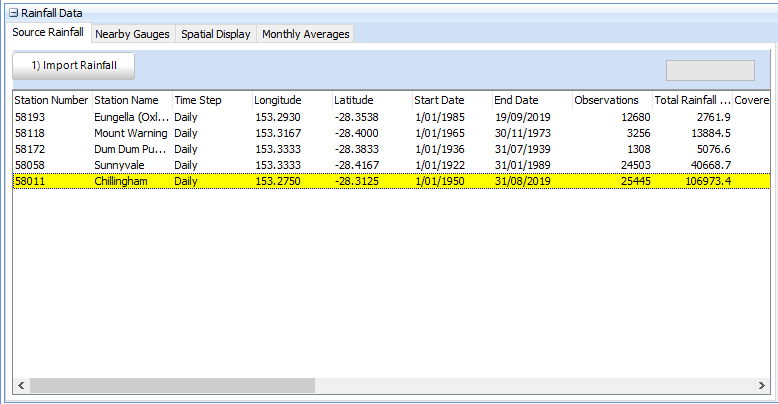
Rainfall files can be imported using the '1) Import Rainfall' button on the Source Rainfall tab of the Rainfall Data panel. When importing rainfall, Storm Injector will automatically calculate all rainfall statistics and the annual maximum series for all the durations in the Settings on the fly. The actual rainfall data will not be stored within Storm Injector.
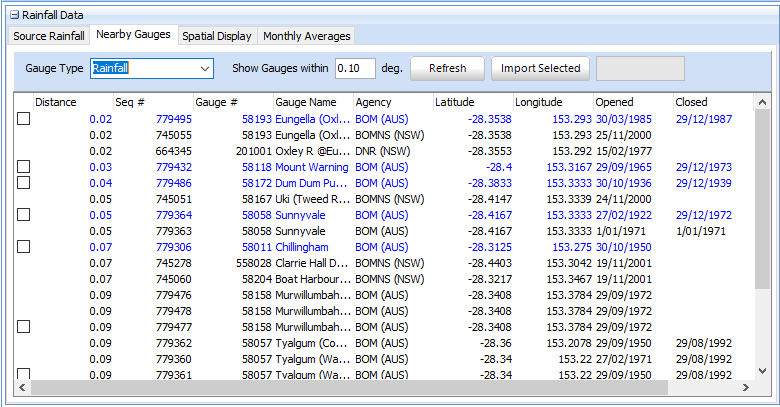
The Nearby Gauges tab will show gauges from a database compiled by CSS that are close to the project (based on the latitude and longitude entered in the Project Setup panel on the Storm Generator tab). Checkboxes on the left hand side will be available for BOM gauges that have daily observations. You can import and analyse the data for these daily observations by checking the checkboxes and clicking the Import Selected button. You will be prompted to select a directory for download of the files. You can also view the webpages associated with BOM gauges by right click on the row and select 'View webpage'. Once the data has been imported and analysed, the row will be shown in blue and it will appear in the Source Rainfall tab.
The Spatial Display tab charts the locations of the project subcatchments (if lat / long available), IFD Locations downloaded from the BOM (on the Storm Generator tab), rainfall datasets imported and nearby gauges that as yet have not been imported by Storm Injector. Monthly averages can be viewed in the Monthly Averages tab.

Spatial Display tab

Monthly Averages tab
To populate the rest of the tables and charts in the At-Site IFD tab, you will need to select the rainfall station of interest in the Source Rainfall tab. The calculated statistics and annual maximum data for each duration should now be shown.
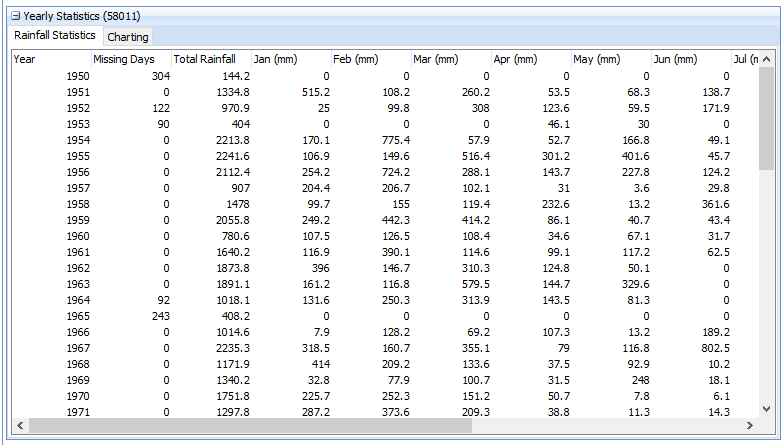
The Yearly Statistics table shows the rainfall totals for each month, the yearly total and the number of missing days for each year covered by the gauge.
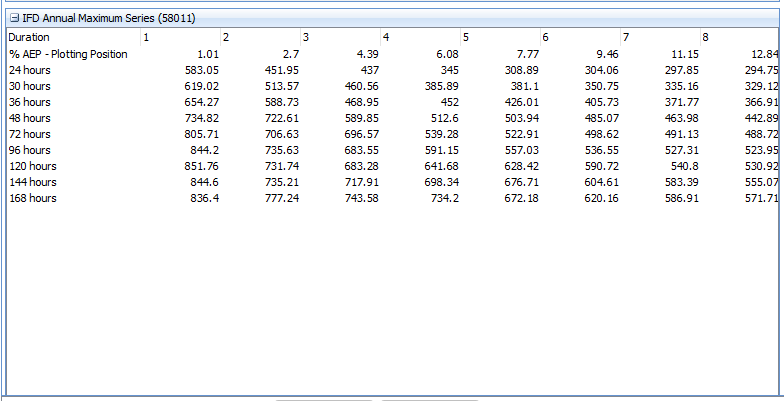
The IFD Annual Maximum Series table shows the maximum rainfall that was calculated in each year for the given duration in decreasing order. The plotting position is also shown in the top row. ARR Book 3 Chapter 2, Section 2.6.2 suggests that a plotting position constant of 0.4 (termed the Cunnane 1978) should be used to maintain consistency. The plotting position value can be modified in the Settings and is 0.4 by default.
Only durations equal or exceeding the time step of the rainfall data will be shown. ARR Book 2, Chapter 3, Table 2.3.4 lists conversion factors to convert daily rainfall observations to 'unrestricted' values. By default, these conversion factors will be used to adjust daily rainfall observations, however, the factors can be changed or turned off in the Settings.
A number of charts are available to help visualise the annual maximum data, their plotting positions and compare them to the IFDs downloaded in the Storm Generator tab. Frequent and Rare IFD datasets will automatically be also shown on these charts.

Duration vs Rainfall for each Plotting Position Chart

AEP (1 in X) vs Rainfall for each Duration Chart
The At-Site IFD feature is in Beta and the data associated is currently stored in a separate file with the .siifd extension. Once the feature comes out of Beta, the data will likely be incorporated into the main *.esi file format. During the Beta period it at site IFD data may not be forward compatible between releases.