CatchmentSIM allows for manually identifying all catchment or subcatchment outlets (Subcatchments >> Draw Outlet), importing a database of subcatchment outlets (Subcatchments >> Import Outlets) or automatically breaking up a mapped catchment or subcatchment based on 2 algorithms (Subcatchments >> Breakup Subcatchment).
To use an automated breakup algorithm, at least one catchment / subcatchment must be have been mapped by manually placing an outlet (Subcatchments >> Draw Outlet) and running Subcatchments >> Map All.
Both methods of automatic catchment breakup, namely, the lateral inflow analysis algorithm and the Horton Stream Ordering algorithm tend to be more successful in many DEMs if stream burning has been undertaken prior to mapping the catchment.
As outlined previously, if a imported stream network is not available, the calculated vector stream network (Flow Mapping >> Generate Streams) can be utilised by first exporting it as a GIS file (Export >> Export to GIS) and then importing it as an imported stream network (GIS >> Streams), prior to applying stream burning (DEM Conditioning >> Burn Streams).
It is also important to consider how many subcatchments are appropriate for breakup considering the resolution of the DEM and the level of detail in the original information that was used to create the DEM. Increasing the DEM resolution does not necessarily increase the amount on information contained in the DEM.
Lateral Inflow vs Horton Ordering
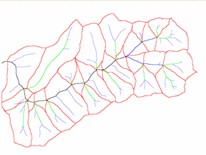
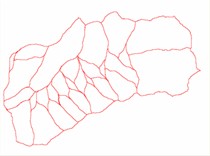
The lateral inflow analysis algorithm and the Horton Ordering based automatic breakup may produce different catchment breakups even when the same number of subcatchments are generated. In general, the Horton Ordering algorithm appears to produce better results. In the example presented in Figure 38 a Threshold Area Comparison was undertaken to determine the appropriate SAT value for generation of the vector stream network (800 pixels in this case) and vector stream network was generate. This can be seen (coloured by Horton Order) in Figure 38. A Horton Order based catchment breakup was then undertaken based on delineating all 2nd order and higher subcatchments. For comparison, the Flow Accumulation Analysis algorithm was also run with the target subcatchments set to the same number that were delineated in the Horton Ordering based breakup.


Figure 38: Comparison of Horton (top) and Flow Accumulation Analysis (bottom) Breakup Algorithms
It can be seen in Figure 38 that the two automated catchment breakup algorithm produce different result. The Horton Ordering breakup seems to deliver a better distribution of subcatchments with a similar size.