Horton / Strahler ordering provides the functionality to derive some key geomorphologic and fractal stream network coefficients, that can be used to examine the hydrologic properties of subcatchments. Once streams have been defined as a specific order, a number of useful parameters and geospatial statistics can be calculated. The most important of these is the bifurcation ratio which is a measure of the relationship between the numbers of streams of different orders. Strahler found that a strong log-normal relationship exists between the logarithms of the number of streams of each order versus stream order. The gradient of this relationship is deemed the bifurcation of the subcatchment. Figure 41 shows the calculation of the bifurcation for the sample stream network illustrated in Figure 25.

Figure 41 : Calculation of Bifurcation Ratio
CatchmentSIM can automatically calculate the bifurcation ratio for the catchment and all subcatchments, as well as a number of related parameters such as Horton drainage density. Interestingly, Strahler's work on topographic maps found strong bifurcation relationships, with bifurcation ratios that were consistently within the range of 3-5. It has been found that CatchmentSIM generated vector stream networks also exhibit this strong relationship, with bifurcation ratios also around this range. This lends weight to the argument that vector stream networks generated over DEMs can closely resemble the fractal nature of natural systems.
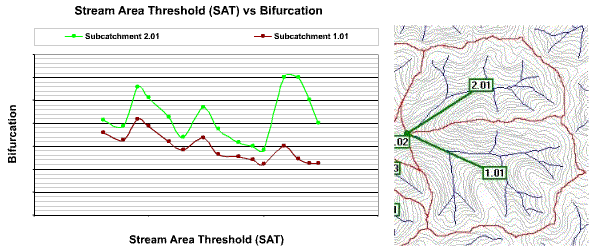
One of the unfortunate attributes of all techniques for analysis of stream networks is that most derived parameters are dependent on the SAT value adopted for generation of the stream network. However, it has been found that the bifurcation ratio is not highly dependent on the SAT value used to generate the network. This is illustrated in Figure 42, which shows the bifurcation ratios calculated for two different subcatchments for a range of vector stream networks calculated at different SAT values.

Figure 42 : SAT vs Bifurcation Relationship for Two Subcatchments
Figure 42 shows that there does not appear to be a strong trend in each of the Bifurcation vs SAT plots. This fact is useful because it implies that deviations in bifurcation ratios across subcatchments within a model may convey important information about the hydrologic properties of the subcatchments and not simply be a function of the adopted SAT value.
For example, in Figure 42, it can be seen that regardless of the SAT value used to generate the vector stream network the bifurcation ratio for subcatchment 2.01 is significantly higher than subcatchment 1.01. The implications of this relationship means that subcatchment 2.01 has a greater proportion of 1st order streams than subcatchment 1.01 (bifurcation plot will be steeper) and the drainage network is more fractal. This information has important hydrologic implications and may mean that subcatchment 2.01 will respond quicker to rainfall and may need to be allocated a smaller lag time or related lag coefficient in any 'downstream' hydrologic or hydraulic model.
This example is presented simply to illustrate some methods of analysis using CatchmentSIM that can provide the basis for assignment of runoff routing parameters in hydrologic models that may be applied. Aside from vector stream network analysis, CatchmentSIM includes a number of other hydrologic analysis tools to help quantify relationships between various subcatchments and even individual pixels.