Storm Injector can be easily used to compare different scenarios for the same catchment. For example, comparing the expected rainfall runoff properties for a catchment in its pre-development state versus a developed state (with increased impervious areas) versus a developed state with mitigation measures designed to bring peak runoff back below pre-development levels. This can be done in a single Storm Injector project which allows the internal charting and analysis tools to be used to compare the events and may help avoid the need for futher analysis and charting in Excel or other tools. Note that if you wish to compare results from different models (scenarios) of a catchment in Storm Injector, it is important that the models are compatible. They should have the same number and naming of their subcatchments. Other attributes such as imperiousness, basins etc can vary.
This tutorial will demonstrate 2 methods to compare scenarios and will be based on the WBNM sample file 'onsite_detention.wbn' . This example file is a single subcatchment small urban catchment a 80% impervious 0.45 hectares with a detention storage structure to mitigate local runoff. For this example, we have also created two derivative version of this model as follows:
•Pre-Development.wbn - the same model with 0% impervious and the detention storage removed.
•Post-Development.wbn - the same model with the detention storage removed.
This tutorial demonstrates 2 methods for modelling and comparing these 3 development scenarios.
For this example, you can use the WBNM ENG version of WBNM which can be downloaded from here. Download and then link the wbnm_eng.exe file in the WBNM Settings >> Engine field in the Settings tab.
Method 1 - Multiple iterations of prepare model runs
1.Click Import Model >> WBNM and select the 'Pre-Development.wbn' file. This file does not have real world coordinates, so click No when asked about converting subcatchments to lat/long coordinates.
2.This example is in Canberra so enter the coordinates of Latitude -35.3000 and Longitude 149.1300 and IFD Name of Canberra.
3.Download the ARR Data Hub information by clicking '2) Get Hub Data'. When the Browser has loaded, click 'Ingest Data'.
4.Download the IFD Data by clicking '3) Get IFD Data'. When the Browser has loaded, click 'Ingest Data'
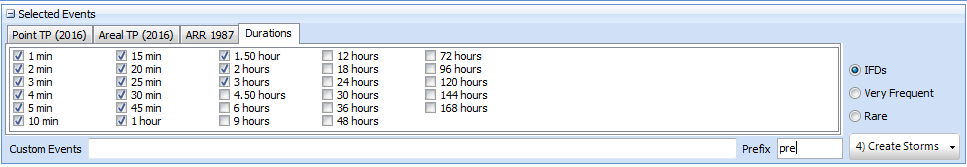
5.Select the 2% AEP rare event in the Point TP (2016) tab of the Selected Events panel.
6.We are only interested in relatively short durations so let's limit the amount of model runs by un-checking all durations greater than 3 hours. This can be done by right click in the Durations tab on the selected Events panel and selecting 'All more than X minutes >> uncheck' and then entering 180 as the threshold duration and clicking OK.
7.Since we are first doing the pre-development scenario, enter 'pre' in the 'Prefix' field and click '4) Create Storms'
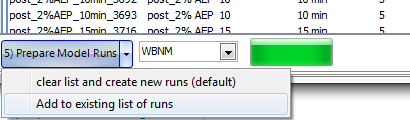
8.Click '5) Prepare Model Runs' and select the 'Pre-Development.wbn' file.
9.To create the post development scenarios, simply change the 'Prefix' to 'post' and click '4) Create Storms' again.
10.Click the drop down arrow and click '5) Prepare Model Runs >> Add to existing list of runs'. Then select the 'Post-Development.wbn' file.
11.Similarly, to create the developed with on-site detention scenarios, simply change the 'Prefix' to 'osd' and click '4) Create Storms' again.
12.Click the drop down arrow and click '5) Prepare Model Runs >> Add to existing list of runs'. Then select the 'onsite_detention.wbn' file.
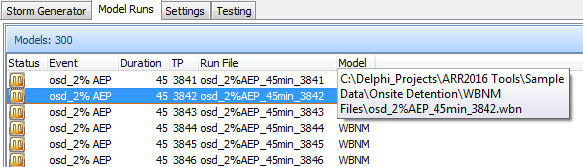
13.In the Model Runs tab, you should now see model runs for all scenarios, TPs and durations. By hovering the cursor over the run file, you should see that each scenario run references the correct model.
14.Ensure the path to the WBNM engine file is correctly set in the settings.
15.Click 6) Run Models.You should see that all the models are run in sequence with up to 4 models running at once. You can switch to hidden window mode to remove the popup window effect.
16.Once the model running is complete, you can click '7) Process Results'.
17.To display comparison Box and Whisker plots, click 'Box Charts' and then 'Chart' in the Compare Events panel. You can now see that the ensemble results for all 3 scenario are shown in sequence. It is worth noting that the critical duration for each scenario is different. If you wish to compare a given critical duration, select this in the Duration combo box in the Compare Events panel. The second image shows the results for the 20 min duration.

Box and Whisker Comparison Charts

20min Box and Whisker Comparison Chart
18.Hydrographs can be compared using the 'Hydrograph Charts' button. Similarly to the Box Charts, click Chart in the Compare Events panel. If you wish to display hydrographs related to a consistent duration, you can select 20 min in the Duration combo box. However, it should be noted that even for a consistent duration, the adopted temporal patterns for the ensembles may still vary. You can select the checkboxes in the Legend for the same temporal pattern ID if you wish to see the results for a given temporal pattern.

Hydrograph Comparison Chart

20 min Hydrograph Comparison Charts

20 min TP 3703 Hydrograph Comparison Chart
Key Points
The key points to keep in mind when comparing events are:
•Only compatible models can be compared. They must have the same number and naming of subcatchments. If you need additional subcatchments in one scenario, you will need to add it in as a dummy subcatchment for all scenarios and change it's attributes when necessary.
•The 'Prefix' option must be used to differentiate scenarios that would otherwise have the same ID.
•Keep in mind that RAFTS does not automatically export basin outflow hydrographs. If you wish to analyse results below a basin, insert a 'dummy' subcatchment below the basin.
TIPs
•If you would like more control over the name of an event, you can use a 0% depth adjustment custom event with the renaming option. For example a custom event of: RInc_2% AEP_0_rare$Pre-Development Scenario (2% AEP)$ will create an event named Pre-Development Scenario (2% AEP) in reports and charts.