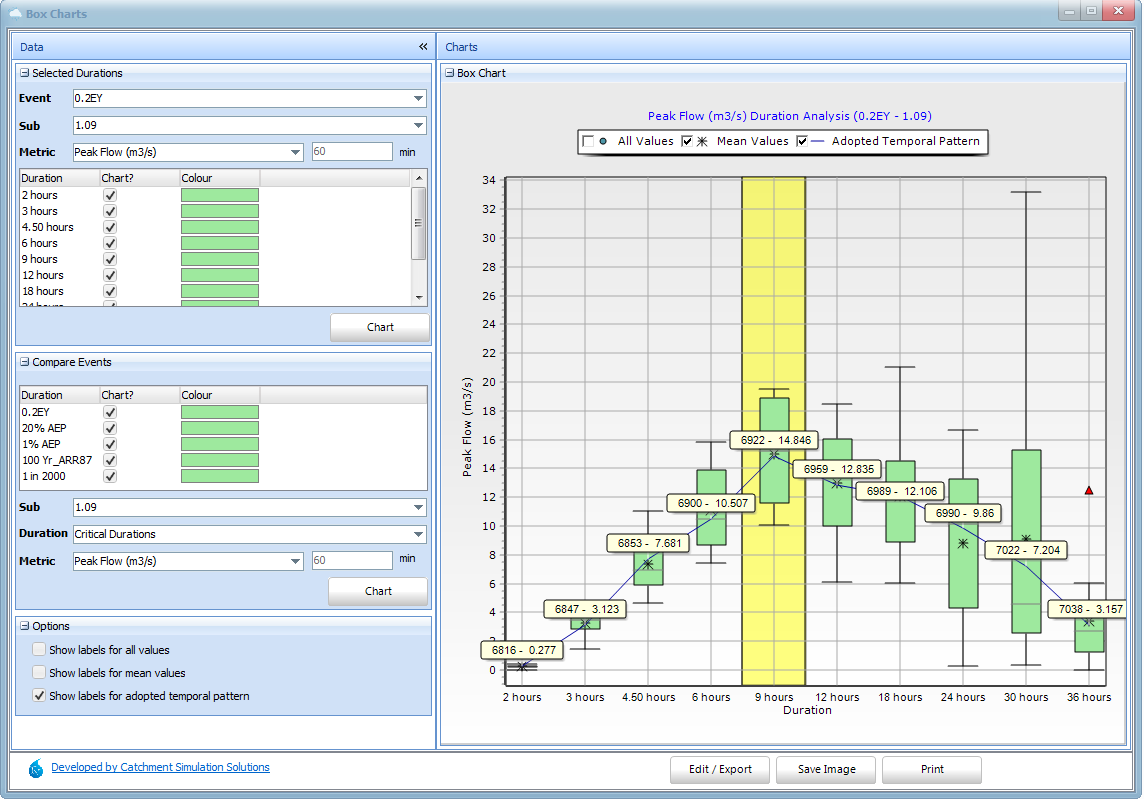
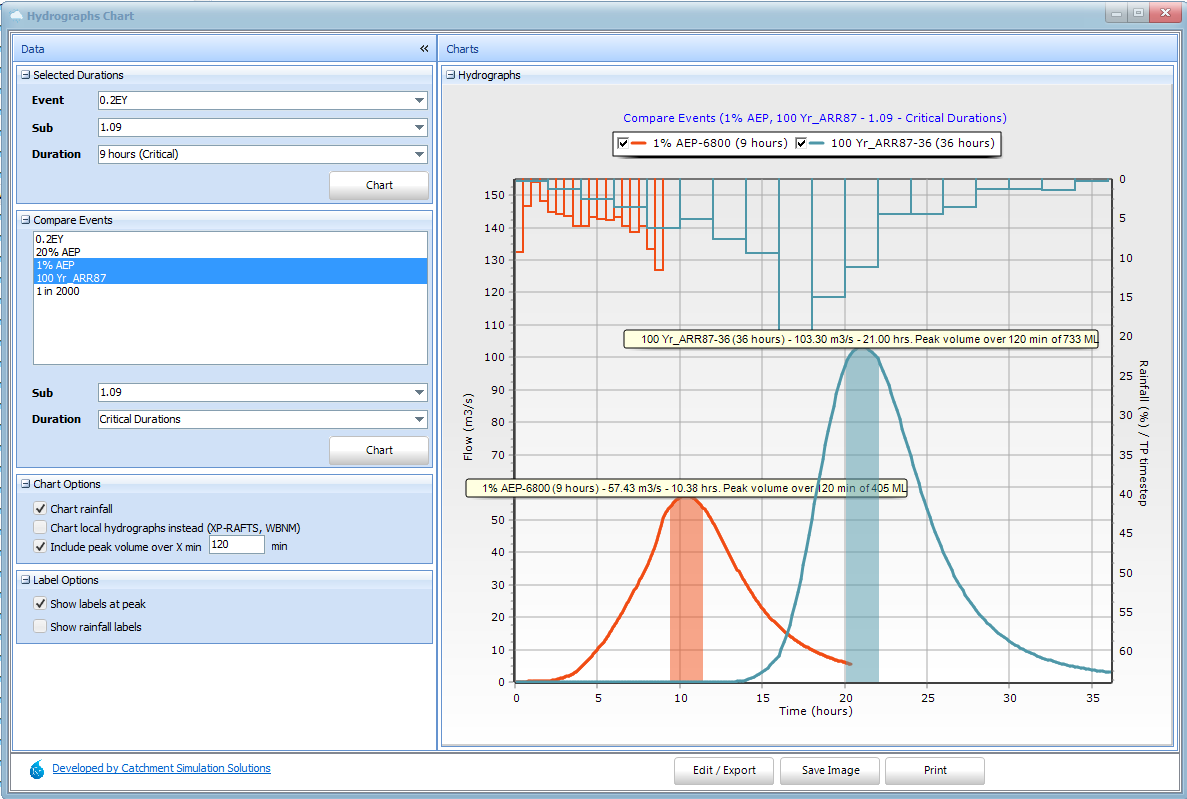
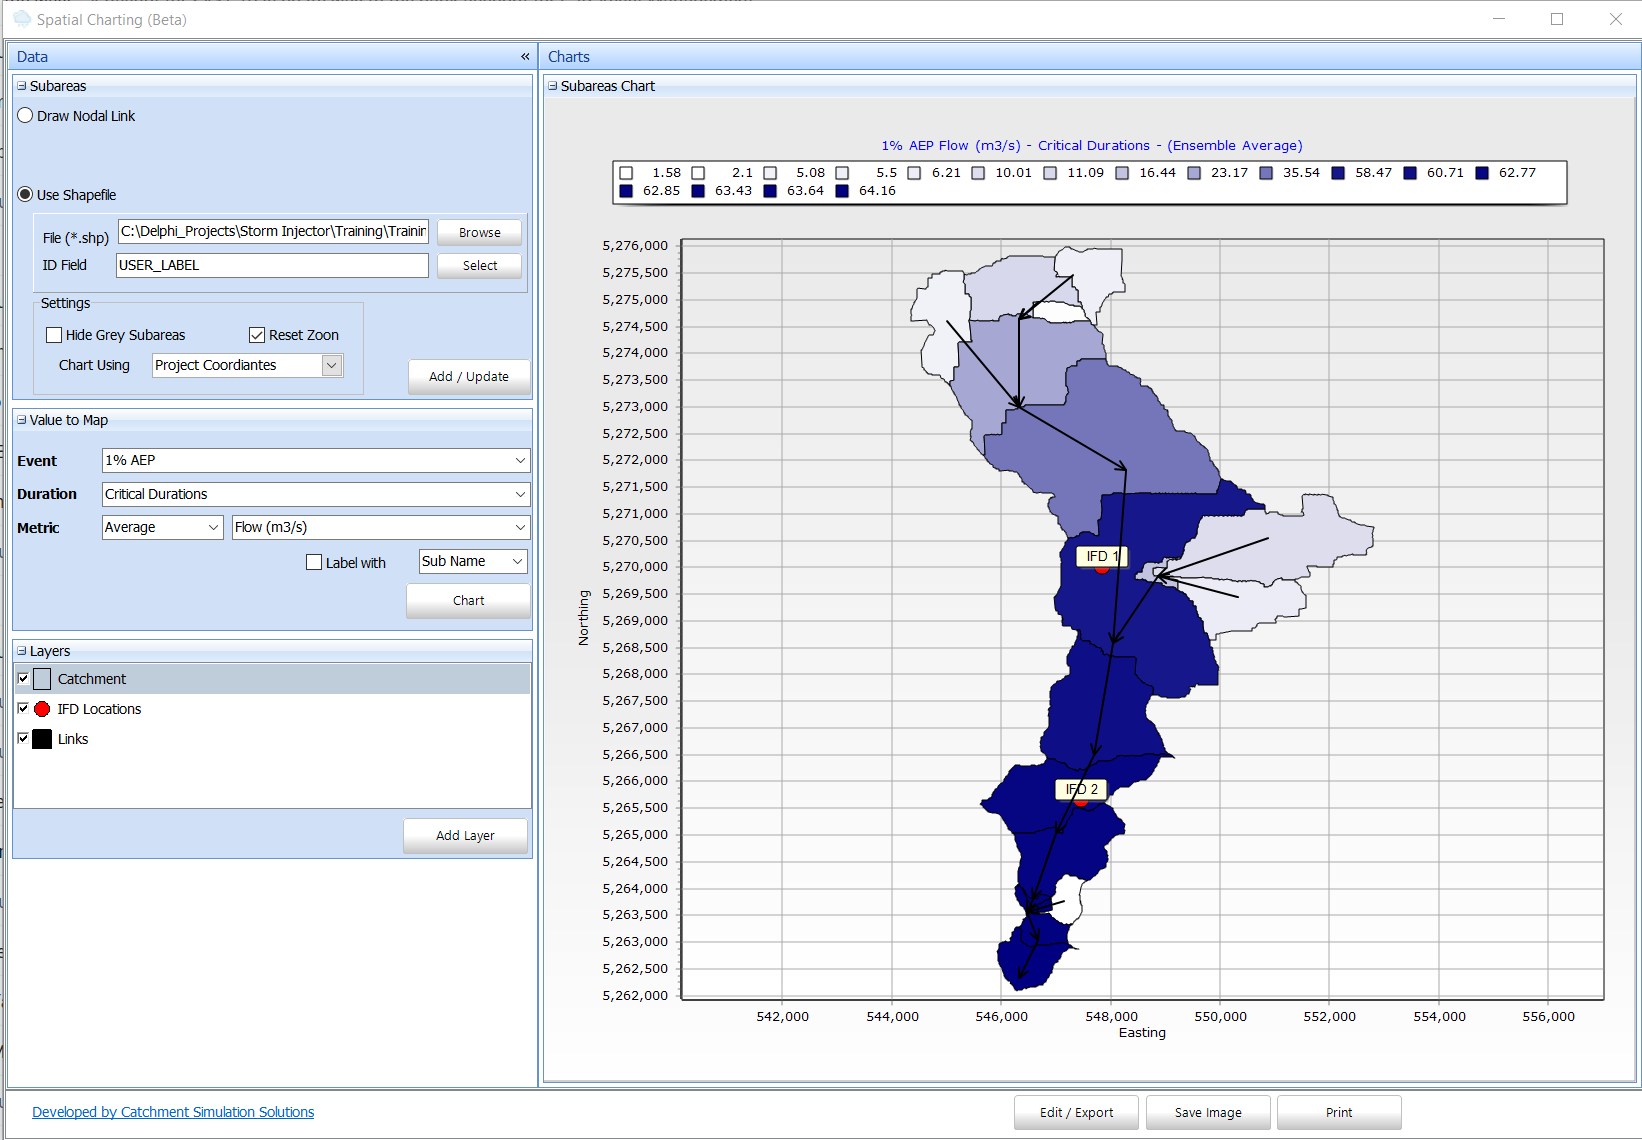
Storm Injector Viewer is free software that can load Storm Injector projects (*.esi), view and analyse results, prepare box and whisker charts and display hydrographs. It provides a powerful and flexible way for Storm Injector users to share and communicate results with their customers and stakeholders. Instead of simply providing some tables and charts in a report, stakeholders can inspect the results and charts for each event, duration and subcatchment at their own convenience.
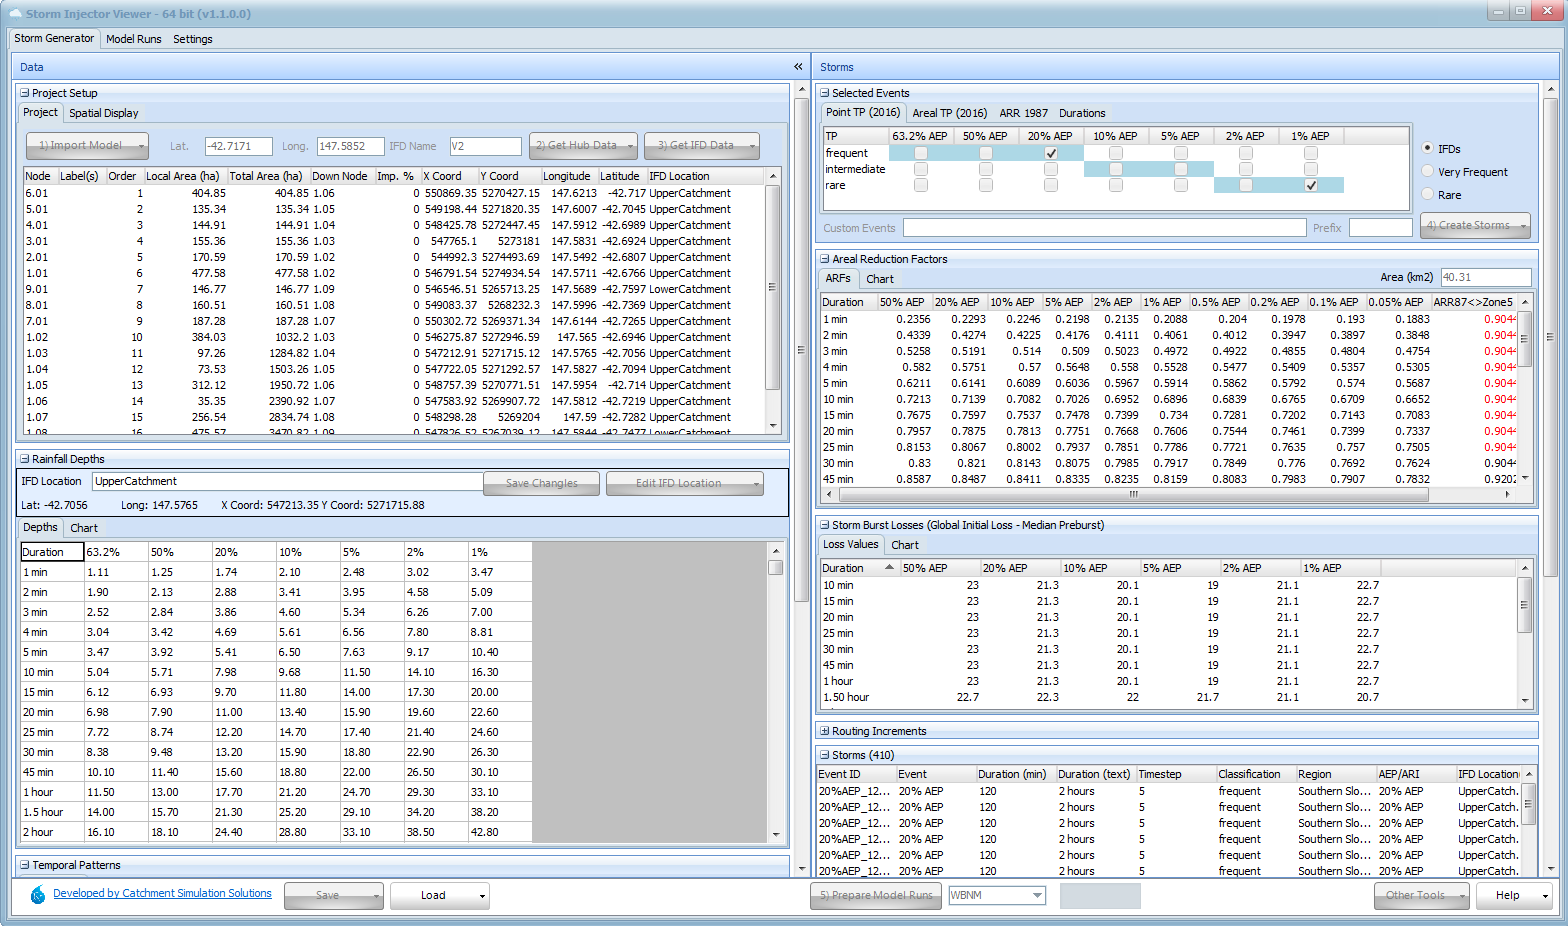
Storm Injector Viewer includes all result charting, analysis and reporting features. However, buttons to download data, prepare and run models are disabled.
Dowload Storm Injector Viewer
Storm Injector Viewer and sample projects can be downloaded from the links in the following table.
Storm Injector Version |
Viewer Download Link |
Sample Project Download Link |
|---|---|---|
1.1.8 onwards |
Storm Injector Viewer Archive
Storm Injector Viewer versions compatible with very old versions of Storm Injector can be downloaded from the following links.
Storm Injector Viewer Archive |
Viewer Download Link |
Sample Project Download Link |
|---|---|---|
1.1.6 |
||
1.0.9 - 1.1.5 |
The help pages in the Using Storm Injector section of this documentation outlines the Storm Injector software in detail. While the Storm Injector Viewer software does not include the capability to download data, prepare or run models, these section may still be useful to help explain the data listed in these parts of a Storm Injector project. The help page that best describes the features available in Storm Injector Viewer is Analysing the Results.
Guide to Preparation of Projects
This section provides some advice for users of Storm Injector (full version) to help in preparing projects for distribution to customers and stakeholders using the Storm Injector Viewer software.
•During normal operation, Storm Injector reads hydrographs directly from the model output files on the fly. In order to load all hydrographs into the project file, use the drop arrow on the Save button and select 'save with all hydrographs (for viewer)'. This will read all hydrographs (including local hydrographs where available) and store them in the project file. Please note that this may represent a large number of hydrographs (there can be up to 2 hydrographs for every subcatchment for every model run). This can result in large file sizes or processing times. This can be minimised by restricting the durations run using the Durations panel. The project file can also be zipped to reduce its file size for distribution.
•It may be useful to users of the Storm Injector Viewer software to be able to compare events or scenarios. Users preparing projects for distribution can achieve this in several ways:
oUsing the 4) Create Storms >> Ad to existing list of storms option
The 'add to existing list of storms' option in the 4) Create Storms button allows additional storms to be added to the existing list using the current settings. This can be used to easily add Frequent, Rare or ARR87 events to a list of Standard IFD events (assuming these IFD datasets have been downloaded). Simply create the storms with the chosen Standard IFD events, select the Frequent radio button, select the frequent event check boxes and then select 4) Create Storms >> Ad to existing list of storms.
oUsing 4) Create Storms >> Ad to existing list of storms option and the Prefix setting
The 'add to existing list of storms' option in the 4) Create Storms button allows additional storms to be added to the existing list using the current settings. This can allow different settings for the same event to be compared. However, it is important to enter a Prefix in these cases to ensure the event has a different name. For example, if you wish to compare the 1% AEP event with and without the application of an ARF you could create the storms as normal (with no Prefix or a Prefix of 'arf'), then change the Area setting to 0, change the Prefix to 'no_arf' and select 4) Create Storms >> Ad to existing list of storms. After preparing, running and processing these storms, you will be able to chart comparison hydrographs and box and whisker plots.