TRIM allows the automation of common post processing methods. These typically include TUFLOW utilities dat_to_dat and TUFLOW_to_GIS. However, TRIM can also utilise the OGR libraries to automatically convert between data formats to create specialised formats such as MapInfo tables, ESRI Shape Files and GeoTIFF grids (which have performance and disk space advantages over ASCII GRID files).
The following video gives an introduction to TRIM Post Processing (be sure to click the quality icon and watch in 720p).
TRIM: Automated Post Processing
Using Post Processing
For most post processing templates, the concept of simulation groups is key. Simulations must be groups to ensure dat_to_dat knows which simulations to group together for the purposes of extracting peak information. The simplest way of assigning groups is by using Event based models. The Auto Add functionality of the Events and Scenarios form will automatically group simulations of the same events (based on the settings).
However, groups can also be assigned in the main queue, simply group select the simulations and right click then select Groups >> Assign to New Group.
You can preview the commands that will be applied during post processing for a group by right click then select Post Processing >> Preview Commands.
If the result files already exist, you can manually run the post processing by right click then select Post Processing >> Do Post Processing Now.
The commands applied during post processing are governed by the selected Post Processing template which is outlined in the following section.
Configuring Post Processing
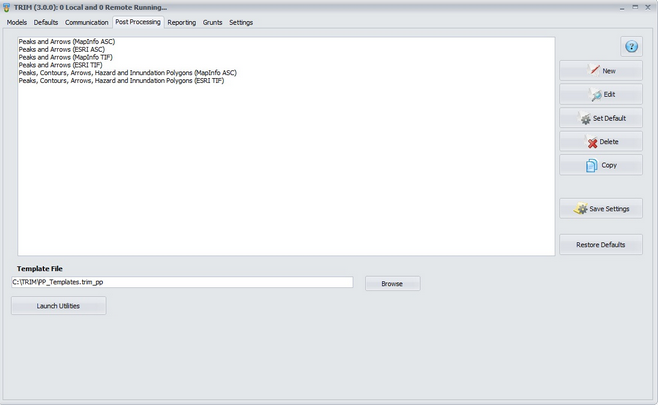
TRIM installs with a number of standard Post Processing templates which can be viewed in the Post Processing tab. There are templates available for both MapInfo and ArcGIS based GIS software.
This form allows you to select a default Post Processing template as well as creating new templates from scratch or by copying an existing template. The Template File box shows where the templates are saved. Template sets can be transferred to different users by simply emailing this file. If you ever wish to restore the default templates, simply delete this file.
Editing Post Processing Templates
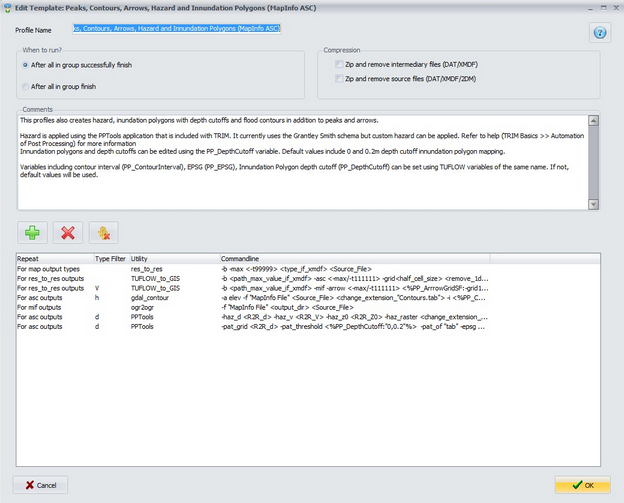
The form below appears when editing or creating a template. As an example, we'll describe the the presented Peaks, Contours, Arrows, Hazard and Innundation Polygons (MapInfo ASC)' template below. This profile creates peak results, depth contours, velocity arrows, custom hazard grid and inundation polygons for 2 depth cutoffs.
The first setting governs if the profile should automatically run as soon as all models are complete or only if all models successfully complete.
The post processing templates also allow intermediary and source files to be zipped following completion of the post processing. This can result in savings of 90% of disk space and reduced file clutter. If you wish to redo the post processing later, TRIM will offer to extract the zip file.
Next, there is a comments section that can be used to record any applicable information or tips.
The main table lists the activities in the template, in this case they are:
oFor all map output types (that are common to all simulations in the group), apply dat_to_dat to get the peak values from each simulation in the group
oFor all the dat_to_dat outputs created by the previous step, run TUFLOW_to_GIS to create a grid of results. Two important notes include:
▪The grid size will be calculated as half the minimum resolution of all 2D domain(s), as recommended in the TUFLOW manual.
▪Any 1D networks that include the text 'subsurface' in their name will be removed from the results. Best practice is to change this text to a specific code that is then used in the filenames for any networks that should be removed from the results during post processing. In this way, the same profile can be used for all projects.
oFor any dat_to_dat results from the first step that are for the map output type 'V' (velocity), run TUFLOW_to_GIS to create arrows. Similarly to the previous step, any subsurface 1D networks will be removed. A post processing variable <%PP_ArrrowGridSF:-grid10%> is also used here. This means that the text -grid10 will be added to the command unless there is a TUFLOW variable called PP_ArrowGridSF. If this variable exists, the value of the variable will be written. For example, you may wish to introduce the scaling factor (-sf) command here.
othe gdal_contour utility will be used to generate depth contours at a contour interval of 1m (unless a TUFLOW variable PP_ContourInterval overrides this setting).
oFor any mid/mif outputs of the previous two steps, automatically convert these to MapInfo tables (*.tab)
oThe PPTools utility is used to create raster and vector representations of hazard. The results are set to MGA Zone 56 (EPSG 28356) unless a TUFLOW variable PP_EPSG exists to override the projection.
oThe PPTools utility is used to create inundation polygons for depth thresholds of 0m and 0.2m. The results are set to MGA Zone 56 (EPSG 28356) unless a TUFLOW variable PP_EPSG exists to override the projection.
POST PROCESSING UTILITIES
From TRIM 1.7.0, TRIM now includes a companion app that allows calculation of other useful data sets based on the TUFLOW results. This app is designed to be able to be used standalone or integrated with post processing templates using the command line. It can be accessed via the Launch Utilities button on the Post Processing tab. The tools available in the app are discussed in the following sections.
Custom Hazard Calculator
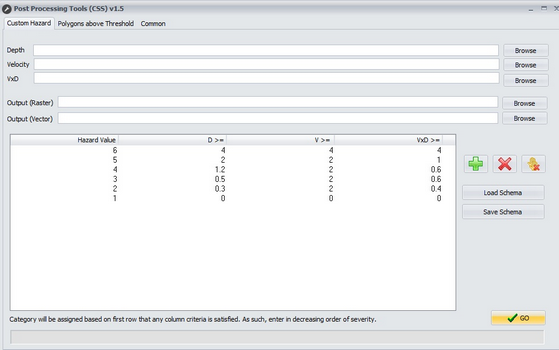
The custom hazard calculator allows a grid of hazard categories to be developed based on V, D and VxD (Z0) results. The grid displays the criteria for each hazard value. It is important that these rows are entered in order of decreasing severity. A cell will be allocated the hazard category for the first row for which any of the criteria are satisfied. The default criteria is based on Grantley Smith's paper 'Delineating hazardous flood conditions to people and property' from the 2015 Floodplain Management Authorities conference (refer Table 1). However, custom profiles can be created, saved and loaded.
The Custom Hazard Calculator can also be automated via command line. The important parameters are:
•Populate the input and output file paths
o-haz_d "file path" - Depth grid
o-haz_v "file path" - Velocity grid
o-haz_z0 "file path" - Velocity - Depth product grid
o-haz_raster "file path" - Ouput grid name
o-haz_vector "file path" - Ouput vector name (file type determined by extension eg shp/tab)
o-epsg EPSG code for output projection (default of 28356)
•-of index of output format. If omitted then default is ASCII Grid. Refer to position in Output Format dropbox for other options.
•-ths "file path" - File path of hazard profile. If omitted, then default is grantley_smith.ths
•- dohazard - Run the hazard calculator and then close the App. If omitted, the form will be displayed and can be activated manually.
To incorporate this tool into a post processing template, a line such as the following can be used in the Post Processing Template.
For asc outputs | d | PPTools | <install_dir>\PPTools.exe" -haz_d <R2R_d> -haz_v <R2R_V> -haz_z0 <R2R_Z0> -haz_raster <change_extension_"hazard.asc"> -haz_vector <change_extension_"hazard.tab"> -dohazard
To use a custom hazard template, first create the template in the Custom Hazard Calculator and then click Save Schema. Next you will need to refer to the new schema in the post processing template. For example:
For asc outputs | d | PPTools | <install_dir>\PPTools.exe" -haz_d <R2R_d> -haz_v <R2R_V> -haz_z0 <R2R_Z0> -ths "path_to_my_hazard_template.ths" -o <change_extension_"hazard.asc"> -haz_vector <change_extension_"hazard.tab"> -dohazard
Inundation Polygons (Polygons above Threshold)
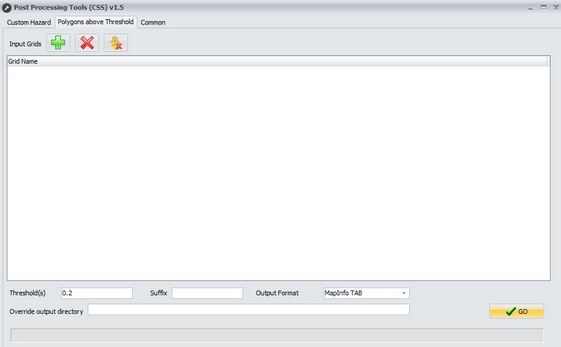
This tool allows one or more grids to be converted to polygons for those values above certain threshold(s). For example, mapping a inundation polygon above a depth of 0.2m. Grids can be added manually using the plus button. One or more threshold can be entered in the Threshold field (multiple depths separated by commas). A suffix can be added to the filenames and the output format can be set.
This tool can also be accessed via command line.
•-pat_grid - the filepath of a grid to be added to the grid name list.
•-pat_threshold - the threshold(s) to be added to the Thresholds field eg "0,0.2" would create two different vector outputs including inundation polygons for depth cutoffs of both 0 and 0.2m.
•-pat_of - the output format (tab or shp)
•-epsg - EPSG code for output projection (default of 28356)
•-do_pat - Run the utility and then close the App. If omitted, the form will be displayed and can be activated manually.
To incorporate this tool into a post processing template, a line such as the following can be used:
For asc outputs | d | PPTools | -pat_grid <R2R_d> -pat_threshold <%PP_DepthCutoff:"0,0.2"%> -pat_of "tab" -epsg <%PP_EPSG:28356%> -do_pat


