From Version 1.2.5, Storm Injector includes the ability to distribute pre-burst over a number of time increments at the beginning of a simulation. Both the amount of pre-burst, and how it is distributed, is highly customisable via the Settings. This feature may be useful in areas where pre-burst depths from the ARR Data Hub exceed initial loss values or where users want to understand how the distribution of pre-burst rainfall over time and its interaction with initial and continuing loss rates may influence rainfall runoff behavior.
Pre-Burst Settings
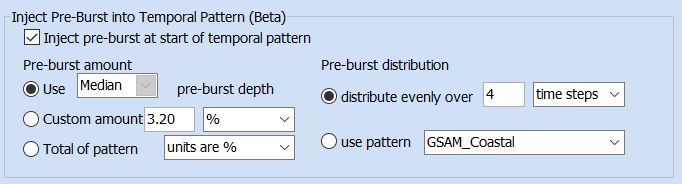
The pre-burst settings available in the Settings tab are shown below.
Setting the Pre-Burst amount
There are numerous options for setting the pre-burst amount in the settings, these include:
•Using median (or 10%, 25%, 75%, 90%) pre-burst from the ARR Data Hub
•Setting a custom amount as either a specified depth in mm or a specified percent of the Net Depth column in the Storms grid
•If using a pre-burst temporal pattern for the distribution method, the user may select to use the patterns total in either mm or percent of the net storm depth
Setting the Pre-Burst Distribution
The pre-burst amount can be distributed over time in a number of ways:
•Equally over a user defined number of time steps
•Equally over a number of minutes (therefore, the number of time steps will vary as a function of the rainfall time step of the temporal pattern for each storm)
•Based on a pre-burst temporal pattern. Several of these are included with Storm Injector including Jordan 2005 (a 7 hour pre-burst temporal pattern), GSAM Coastal (6 pre-burst temporal pattern for various durations) and GSAM Inland (5 pre-burst temporal patterns for various durations). However, the user can easily implement their own pre-burst temporal patterns as well. The pre-burst temporal patterns are shown in the Pre-Burst Temporal Patterns panel in the Settings tab. When using a custom pre-burst temporal pattern that will be applied to storm with relatively short durations, it is suggested that a time step of 5 minutes is used. This is because 5 minutes divides evenly into all the rainfall timesteps for the ARR2019 temporal patterns.

Pre-Burst Temporal Patterns
Creating Storms
When creating storms with pre-burst injection, pay attention to the Pre-Burst Depth and Pre-Burst Increments columns in the Storms panel. The 'Pre-Burst Depth (mm)' columns shows the amount of pre-burst for this storm. The 'Pre-Burst Increments' column indicates the number of time steps in the simulation that are pre-burst and these time steps are drawn with blue text. The numbers in these cells relate to the percentage of the 'Pre-Burst Depth (mm)' column that will be injected into the simulation file for this time increment. If there any any errors in assigning pre-burst such as no available pre-burst temporal pattern, these will be shown as a hint for the cell and the text will be in red.

Pre-Burst Depth and Increments in Storms Panel
In this case, the Jordan 2005 pre-burst temporal pattern is being used with the total of the pattern in percent as the pre-burst amount. This equates to 3.2% of the Net Depth of 291mm which is 9.3mm. The Jordan 2005 pattern is a 7 hour temporal pattern which is 14 time increments at the storm rainfall time step of 30 minutes. If the storm time step was 1 hour, then the pre-burst increments would be 7 and the pre-burst temporal pattern would be aggregated to hourly increments automatically.
Viewing Results
When displaying the hydrographs associated with storms that included pre-burst modelling, the chart will display the pre-burst period as a vertical blue line in the chart. When rainfall options are turned on, the rainfall during the pre-burst period will also be displayed. When displaying the rainfall in '%', care should be taken as the pre-burst time steps percentages refer to a percent of the pre-burst amount rather than the rest of the rainfall chart which refers to the percent of the net storm depth. As such, a direct comparison may be misleading. Storm Injector also allows charting of rainfall in depth (mm) or rainfall excess (mm). However, for projects with multiple IFD Locations, the project setup panel must be populated to help cross reference the IFD location for each subcatchment. An example is presented below of hydrograph and rainfall depth charting with pre-burst rainfall distribution via a temporal pattern.

Hydrograph and Rainfall Depth Charting