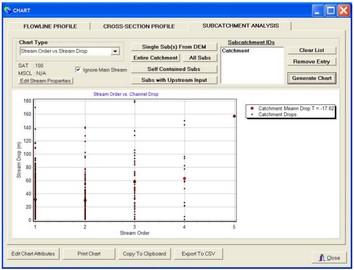
This chart allows a user to analyse the stream drop vs stream order relationship derived from the vector stream network. This chart is based on the work of a number of researchers including Tarboton et al. (1991) who stipulated that geomorphologic laws including the power law of link slope with area (Flint 1974) and the constant stream drop law (Broscoe 1959) can be assumed to hold for generated stream networks similarly to field-surveyed stream networks. The law of constant stream drops states that the mean drop between start and end elevations of stream segments of different Strahler orders should have no clear trend. Tarboton suggests using a Student's t-test to assess the difference in means between the mean stream drop of 1st order Strahler streams and the mean stream drop of all higher order Strahler streams for a range of stream networks generated at different SAT values. The minimum SAT that yields a stream network where the t-test indicates that the means are not statistically different with a 95% confidence interval (ie., t ˜ 2) should be adopted.
The stream order vs stream drop chart plots all the stream drops for each stream segment according to stream order as well as the mean stream drop for each order (larger dots). The Students t-test value is also derived and shown in the legend.
It can be see that for this example, the vector stream network generated with an SAT of 100 results in a t of -17 indicating that there is a relationship in the stream drop distribution hence the network is not geomorphological valid (ie., the SAT is too low and there are too many first order streams resulting in two low a 1st order mean stream drop). To determine an appropriate SAT to use to generate a vector stream network the Threshold Area Comparison chart can be used.
