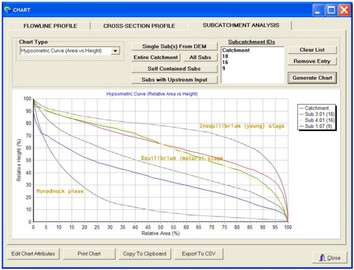
The hypsometric curve chart provides a measure of the geomorphologic state of the subcatchment. Horton observed that subcatchments in different state of their geomorphological evolution had different relative height vs relative area relationships. This chart includes a background picture illustrating Horton's hypsometric profiles.
