The Threshold Area Comparison chart can be used to determine the highest level of vector stream network discretisation that fulfils the constant law of stream drops (Broscoe 1959). For more information on how this law is applied to analyse vector stream networks, please see the Stream Order vs Stream Drop chart.
This chart will derive a set of vector stream networks, determine their Student's t-test values and bifurcation and plot them for the range of SAT values. When the Generate Chart button is clicked the following form will be generated.
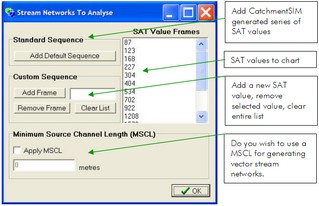
This chart governs the list of SAT values that will be analysed. To start by imputing a CatchmentSIM derived list of SAT values, click Add Default Sequence. This button will add a selection of SAT values which should include an SAT appropriate for ensuring consistency with the constant stream drop law. Individual SAT values can be added or removed using the Custom Sequence controls. A Minimum Source Channel Length (MSCL) option can also be used. After clicking OK, CatchmentSIM will generate a vector stream network for all the SAT values selected and determine associated parameters including bifurcation and Student's t-test (this algorithm can be time consuming if many SAT values have been added). The values are then plotted such as in the chart below.
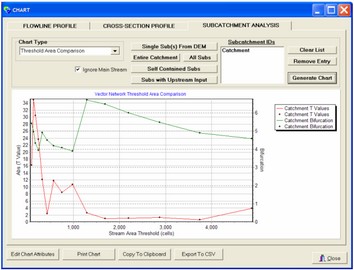
The Student t-test values are shown on the bottom. As described under the Stream Order vs Stream Drop chart, the minimum SAT that yields a stream network where the t-test indicates that the means are not statistically different with a 95% confidence interval (ie., t ˜ 2) should be adopted. It can be seen that for this example, this occurs around an SAT of 1500 which is the finest vector stream network consistent with the law of constant stream drops.

