The 'Rainfall' tab allows you to specify your input rainfall information for your simulation.
A description of each item on the 'Rainfall' tab is provided below.

Rainfall Type: Rainfall input can be specified in two different ways for each simulation; 'Uniform Intensity' or 'Spatially/Temporally Varying'. 'Uniform' is useful when initially setting up and testing your model and will apply a constant rainfall intensity to every grid cell in your project for a specified duration. 'Spatially/Temporally Varying' allows you to apply spatially and temporally (i.e., time varying) rainfall to each grid cell in your project. Further information on the different inputs is provided below.

If you select the 'Uniform Intensity' radio button, the 'Uniform Rainfall Input' will be activated allowing you to specify a rainfall intensity and rainfall duration.
Intensity (mm/hr): Used to specify the rainfall intensity (in mm/hour) that will be applied to each grid cell in your project.
Duration (mins): Specifies the duration in minutes that the rainfall intensity will be applied to the project grid. The rainfall intensity will be applied from the simulation start date and time and will conclude after the specified duration. For example, an intensity of 50 mm/hr and a duration of 60 minutes will apply 50 mm of rainfall to each grid cell in the project for the first 60 minutes of the simulation.
If you select the 'Spatially / Temporally Varying' radio button, the 'Temporal / Spatially Varying Rainfall Input' will be activated allowing you to specify time-varying rainfall information for up to 9 rainfall gauges.
Number of Rainfall Gauges: used to specify the number of rainfall gauges that you would like to use to describe the temporal and spatial distribution of rainfall across your project area. Up to 9 gauges may be used for each simulation. A minimum of 1 gauge is required for all simulations. However, a minimum of 2 gauges is required if you wish to apply spatially varying rainfall to your project (1 gauge will apply the same rainfall amount to each grid cell)
Each rainfall gauge will be have it's own tab. For example, if you specify 2 gauges, 2 tabs will appear. To access or edit information for each gauge, simply click on the appropriate tab.
Name: Used to add an appropriate name for each gauge.
Easting: Used to define the easting (i.e., x coordinate) of the rain gauge. This information is required so the GSSHA knows where this rain gauge is located spatially.
Northing: Used to define the northing (i.e., y coordinate) of the rain gauge. This information is required so the GSSHA knows where this rain gauge is located spatially.

The above table is used to specify all rainfall input information for each rain gauge. This includes the date and time and the corresponding rainfall depth for that date/time. The rainfall information can be input in 2 different ways - manually inputting information in each table cell or opening an Excel spreadsheet containing the rainfall information. The later approach is considered to provide the most efficient.
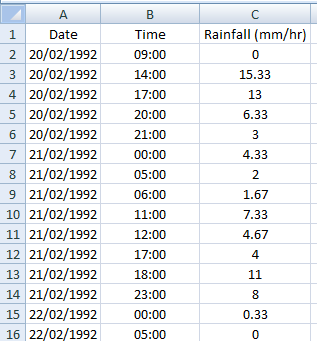
To load the rainfall information from an Excel spreadsheet click the "![]() " button. The spreadsheet and the rainfall data contained within the spreadsheet most be in the correct format (also note that only Excel spreadsheets in 97-2003 *.xls format are currently supported). The following image shows a correctly formatted Excel spreadsheet:
" button. The spreadsheet and the rainfall data contained within the spreadsheet most be in the correct format (also note that only Excel spreadsheets in 97-2003 *.xls format are currently supported). The following image shows a correctly formatted Excel spreadsheet:

The first column contains a header line followed by the date of the rainfall record in dd/mm/yyyy format. The second column contains a header line followed by the time of the rainfall record in 24 hour format (e.g., 3:00pm = 15:00). The third (and final) column contains a header line followed by the rainfall depth in millimetres.
It is important that there are no 'blank' rows beyond the last row of input information otherwise you will receive an error when trying to open the Excel file (it is generally a good idea to delete the last dozen rows from the spreadsheet to ensure there are no stray spaces in any of the columns). Please also note that only information from the active tab in the spreadsheet will be imported. Therefore, if you have several rainfall gauges, it will be necessary to save the rainfall data for each gauge to a separate file (or have a different active page for each gauge and repeatedly re-save the file with a different active page before opening in the GSSHA interface).
Any time step can be used for the rainfall information and this does not need to be constant throughout your simulation. So you can, for example you can have smaller time steps where there is rapid variation in rainfall values and larger time steps where there is little to no variation in rainfall values. However, although the time steps can vary, the same time steps must be applied to each and every gauge in your project. That is, the data and time columns must be identical for every gauge.
Once any rainfall information has been input, it can be graphed by selecting the " " button. The rainfall information for each gauge will be plotted together. Rainfall data for a particular gauge can be removed by 'unchecking' the appropriate gauge in the legend near the top right corner of the graph. The formatting of the graph can also be modified and the graph image can be copied to the clipboard and also saved to file using the icons in the toolbar at the top of the graph. The raw data can also be exported to a text file or Excel.

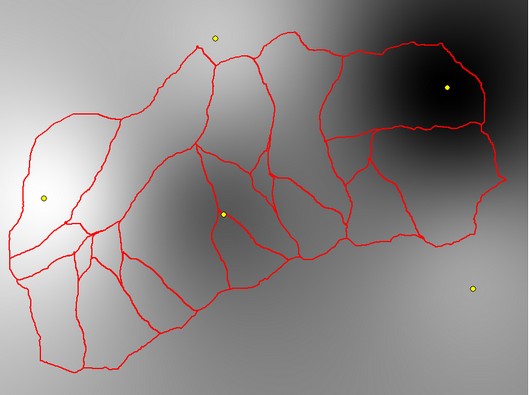
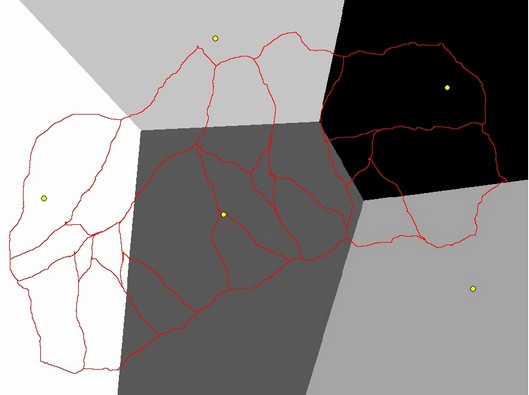
The rainfall information that is specified is typically only available at a single location. Therefore, it is necessary to interpolate rainfall values for all other grid cells in the project. Two different interpolation algorithms are available in GSSHA:
Inverse Distance Weighted: Applies an inverse distance-squared average interpolation to assign rainfall values for each time step for each grid cell. An example of rainfall depth grid that has been interpolated for 5 rainfall gauges (refer yellow dots) using the inverse distance weighted interpolation in provided below (the darker colours indicating higher rainfall depths):
Thiessen Polygon: Applies a Thiessan Polygon (i.e., nearest neighbour) interpolation routine to assign rainfall values to each grid cell for each time step. An example of rainfall depth grid that has been interpolated for 5 rainfall gauges (refer yellow dots) using the inverse distance weighted interpolation in provided below (the darker colours indicating higher rainfall depths):


