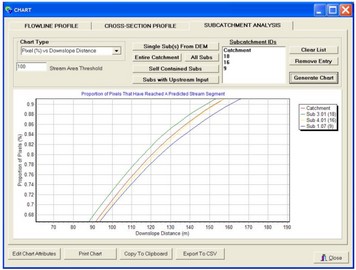
This chart plots distance vs the proportion of pixels within a subcatchment that will have reached a raster stream pixel by the time they have travel such a distance. Thus, as distance increases, pixels (%) will approach 1 (100%). This chart illustrates how rapidly a subcatchment can be drained. For example, the chart below indicates that after 120m of flow path, flow from 78% of pixels from subcatchment 1.07 will be 'in-stream' whereas 82% of pixels from subcatchment 3.01 will be 'in stream'. This (considered in conjunction with slope and land use can help assign relevant runoff routing parameter in subsequent rainfall runoff models.
