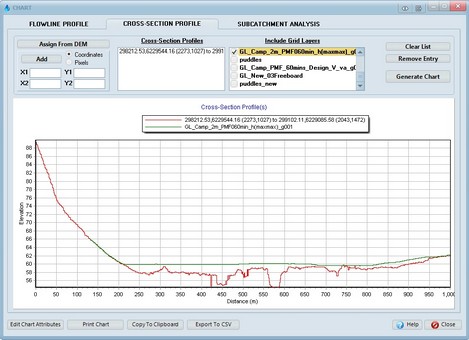
The cross-section profile chart illustrates a cross sectional profile drawn between two point in the DEM. To select the end points for the cross-section visually select the Assign From DEM button. After selecting this button, the form will disappear and you can select the cross-section by two left click at either end of the intended cross-section alignment. At this stage, the Chart form should reappear with the list box filled with the cross-section profile. Alternatively, cross sections can be added by manually typing in either the coordinate value pairs or pixels corresponding with the cross-section end points. At this point additional cross-sections can be added. When finished, select Generate Chart to graph the cross-sectional profiles. Grid layers can also be added to the chart using the Include Grid Layer check list box.
