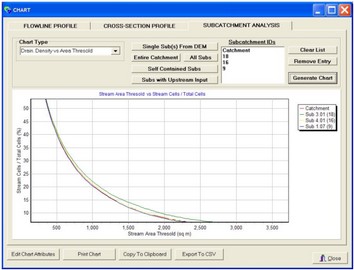
This chart plots how raster drainage density (proportion of pixel within a subcatchment that have a flow accumulation greater than the Stream Area Threshold) varies with the Stream Area Threshold. It can be seen from the chart below that for a given SAT (for example 1500) subcatchment 3.01 has a higher drainage density, which indicates that it may be better drained. This can help to assign runoff routing parameters in subsequent modelling.

