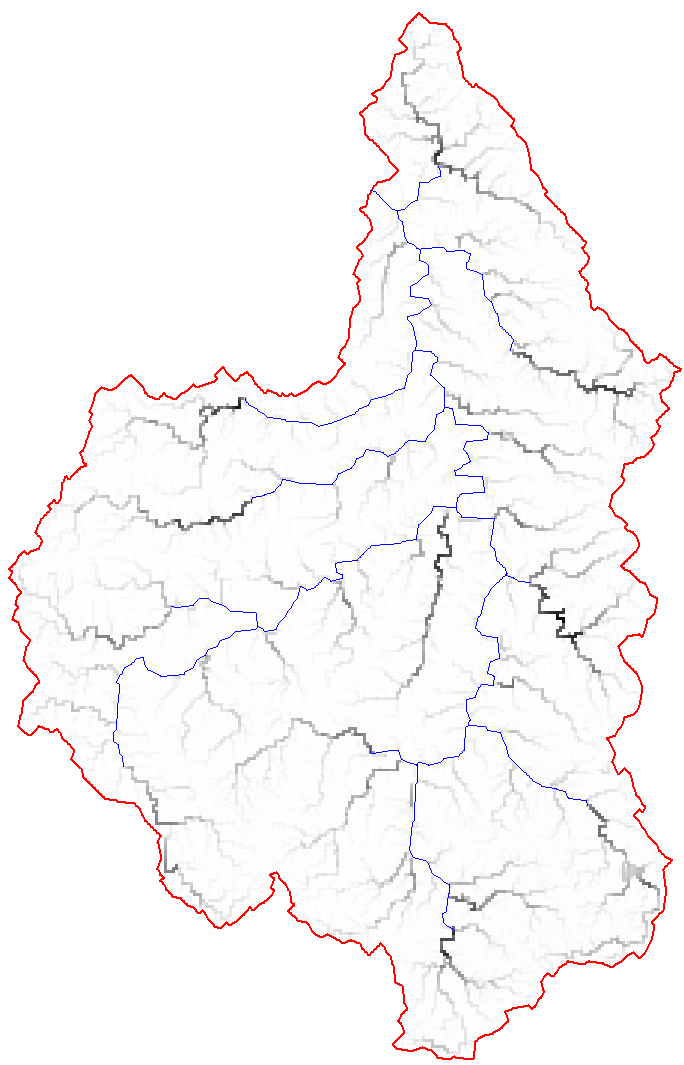
The 'Output' tab is used to specify required output information and interrogate simulation results.
A description of each item on the 'Output' tab is provided below.
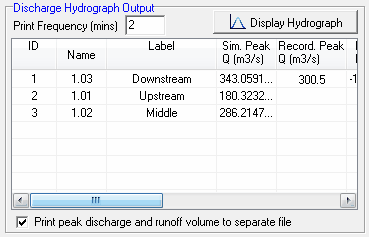
Print Frequency (mins): Used to specify the frequency that time and discharge information is written to file. A smaller print frequency will typically provide a "smoother" hydrograph as there are a greater number of data points to create the hydrograph from.
The table in the centre of this section of the interface is used to display the results of the GSSHA simulation at each subcatchment outlet. The table will list the peak discharge, time of peak discharge and runoff volume at each subcatchment outlet. If recorded discharge hydrograph information is available, the table will also provide a comparison between simulated and recorded discharges, time of peak and runoff volume, which can be of assistance during model calibration calibration.
Print peak discharge and runoff volume to separate file: select this check box if you would like to record the peak discharge and runoff volume at each subcatchment outlet to a text file. The text file will have the following filename: "*Peak_Discharge_&_Volume.txt"
Once a simulation has been completed, the hydrographs at each subcatchment outlet can be viewed. To view the hydrograph for a particular subcatchment, highlight the appropriate row in the table and then click the '' button. The input rainfall will also be displayed on the hydrograph chart.
The rainfall information and discharge hydrographs can be turned on and off by selecting the appropriate check box in the legend near the top right of the chart. The chart can also be modified, printed, saved and copied to the clipboard using the buttons on the toolbar at the top of the chart. All of the discharge and rainfall information can also be exported and saved to a text file or Excel spreadsheet using the toolbar.

Units: Enables you to specify whether metric or English units will be used for all model inputs. Note that a mixture or metric and English units cannot be used with GSSHA.

If you would like to include a recorded discharge hydrograph for calibration purposes, click the ' ' button. This will open the recorded hydrograph dialog, which is shown below:
Currently only recorded hydrographs exported from the PINEENA database are supported. Dates must be exported from PINEENA in hh:mm_dd/mm/yyyy format. For example, the following CSV file is in a suitable format:
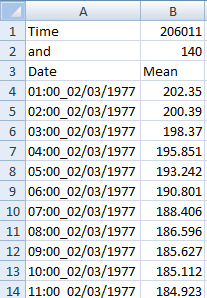
To import a recorded hydrograph from PINEENA, click the ' ' button and select the PINEENA CSV file. The information from the CSV file will be displayed in the table on the right of the dialog.
Next you must assign this hydrograph to a subcatchment outlet (to enable us to compare the recorded and simulated hydrographs at the same location). Select the subcatchment that you would like to add the hydrograph to from the drop down box and the click the ' ' button.
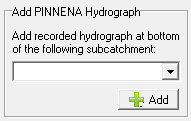
The hydrograph should now appear in the 'Available Recorded Hydrographs' section of the dialog, along with key attributes such as peak discharge, time of peak and runoff volume. To delete the recorded hydrograph, click on the entry in the 'Available Recorded Hydrographs' table and click the ' ' button.
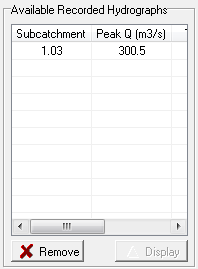
To graph the full recorded discharge hydrograph, click on the appropriate row in the 'Available Recorded Hydrographs' table and click the ' ' button.
To add the recorded discharge hydrograph(s) to the GSSHA project, select the ' ' button. You should find that 'No. Recorded Hydrographs' value will be updated reflecting the number of recorded hydrographs that were added.

The grid-based results from the GSSHA simulation can optionally be saved to file. Grid-based outputs can provide additional insight into the spatially distribution of results across a catchment.
Format: is used to specify the output file format of the results grid. ArcInfo ASCII Grids, WMS ASCII Maps, WMS Map and XMDF map file formats are currently supported.
Output Frequency (mins): Specifies the frequency, in minutes, at which grid files are written to file. It should be noted that the grid files can be quite large. Therefore, creating numerous grid files at a small output frequency has the potential to consume considerable hard drive space.
Rainfall: Check this box if you would like GSSHA to generate grids showing the spatial distribution of rainfall depth at the nominated output frequency.
Depth: Check this box if you would like GSSHA to generate grids showing the spatial distribution of runoff depth at the nominated output frequency.
An example of a grid generated by GSSHA, is provided below:
