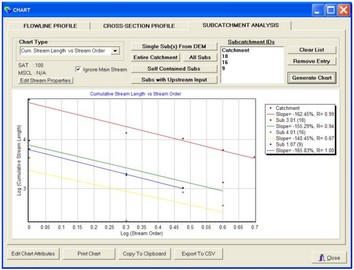
This chart is also calculate based on Horton Order, yet typically has a far weaker relationship than the bifurcation relationship. This chart plots the log cumulative stream length for stream of each order versus the log of the stream order. It can be seen in this case that the line slopes are quite similar and the fit rations are relatively weak except for the catchment as a whole and subcatchment 3.01 (ignore fit for 1.07 as there are only two points). However, this chart can provide valuable information on the fractal nature of subcatchments when viewed in conjunction with the bifurcation chart and vector drainage density parameters.
