Obtaining IFD Values (Australia Only)
The 'Get Australian IFD Values' menu item takes advantage of the Australian Bureau of Meteorology's (BOM) online IFD data system. The IFD data system uses a process developed by the BOM known as CDIRS (Computerised Design IFD Rainfall System), which allows automatic determination of a full set of IFD curves, tabulated data and polynomial coefficients for any location in Australia, simply by supplying its latitude and longitude. The CDIRS is compatible with manual procedures outlined in 'Australian Rainfall and Runoff: A Guide to Flood Estimation, Book 2, Volume 1' (Institution of Engineers Australia, 1987).
CDIRS IFD data can be extracted for any location from a database of grid point values. The data is gridded to a resolution of 0.025 degrees and is available for all of the Australian mainland, Tasmania and extends offshore sufficiently to include most nearby islands (e.g.,Thursday Island). All requests for CDIRS data are provided for the grid point nearest to the requested location. For example, a request for "-35.278, 145.321" will be rounded to the nearest grid point at "35.275, 145.325".
In order to use the IFD feature you must have setup a new CatchmentSIM project (this includes specifying the Design Plane extent and Projection).
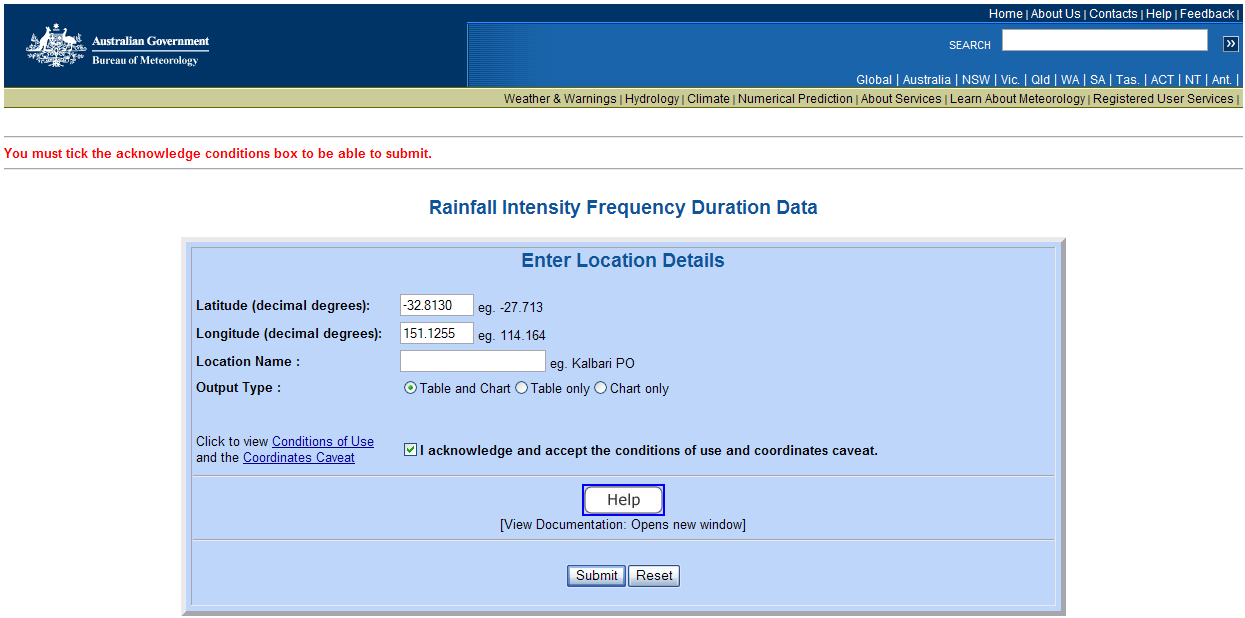
Once the 'Get Australian IFD Values' menu item is selected in CatchmentSIM, the BOM 'Rainfall Intensity Frequency Duration Data' website is opened and the latitude and longitude at the centre of the CatchmentSIM design plane are automatically entered in the 'Enter Location Details' section of the webpage, as shown below. If a project title has been specified for the CatchmentSIM project this will also be incorporated as the 'Location Name' (this is not required). Once you have read the 'Conditions of Use' and 'Coordinates Caveat', ensure that the 'I acknowledge and accept the conditions of use and coordinates caveat' box is checked. Then press  .
.
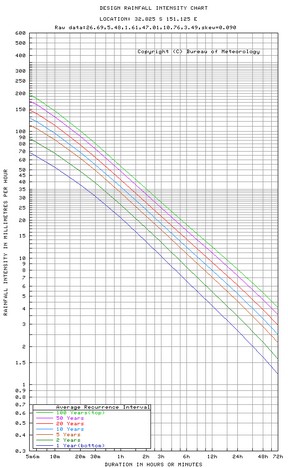
The CDIRS will extract the polynomial coefficients of the nearest grid point and will use these coefficients to prepare IFD tables and curves as shown below.
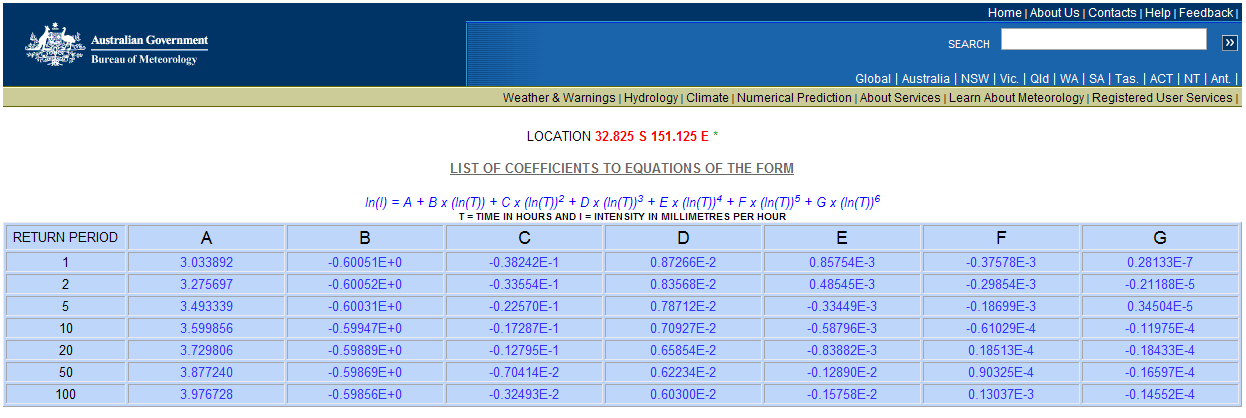
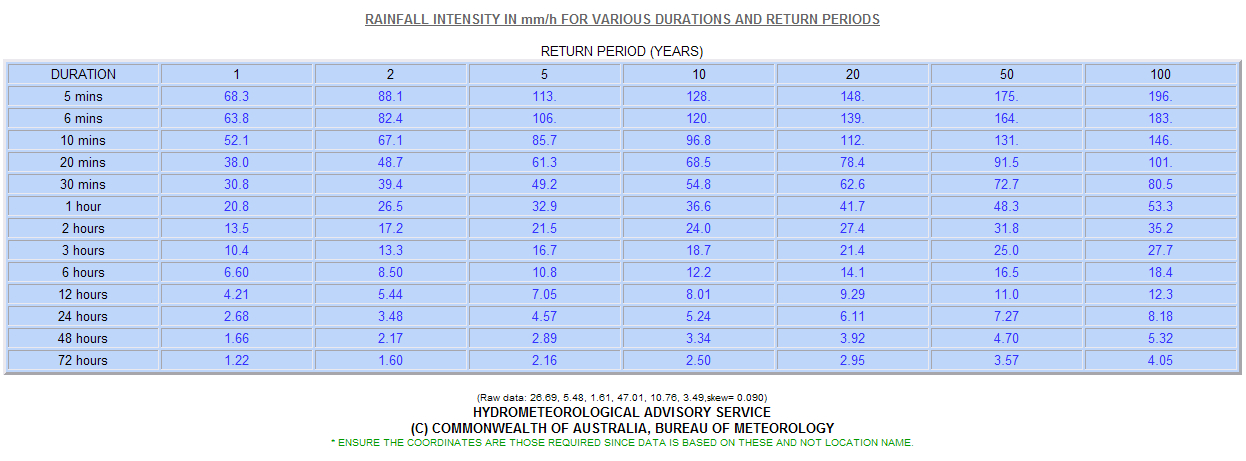
The coefficients and IFD table can be copied from the BOM webpage by selecting the contents of the table (by left-clicking and dragging from the top left corner of the table to the bottom right corner of the table) and either pressing Ctrl+C or by right clicking and selecting 'Copy' from the popup menu as shown below. The coefficients table can be saved in CSV file format and used in conjunction with the Raster Calculator and Tc scripts to derive peak discharge estimates for you study area based on the Probabilistic Rational Method.

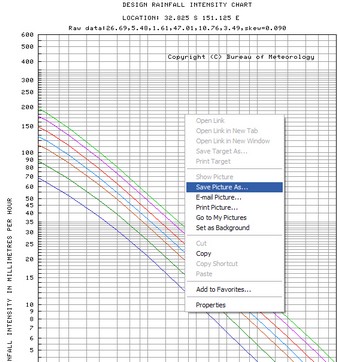
In addition the IFD chart can be saved as a PNG or BMP image file by right-clicking on the graph and selecting 'Save Picture As...' from the popup menu, as shown below. Alternatively, the image can be copied and pasted into other applications (e.g., Microsoft Word) by selecting 'Copy' from the popup menu.
