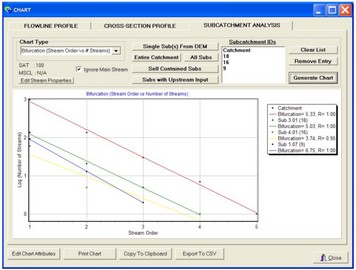
The bifurcation chart is based on the Horton / Strahler ordering techniques as described in the Algorithm Section. Bifurcation charting adds two series to the chart for each subcatchment. The circular dots are the stream order vs log number of stream of that order and the line is the best fit (bifurcation). The bifurcation (slope of the line) and an indication of the fit (R) can be seen in the legend.
| Note: | The checkbox labelled Ignore Main Stream is included for analysis of subcatchments as apposed to the catchment as a whole. If you are analysing a subcatchment with upstream inputs the main stream(s) actually continues from upstream subcatchments, hence using stream drop, stream order, or stream length parameters for this stream is not appropriate. This checkbox is available in the Bifurcation, Cum Stream Length vs Order, Stream Drop vs Stream Order and Threshold Area Comparison charts. |
The steeper the line, the higher the bifurcation and this generally means that the generated vector stream network is more fractal (higher proportion of 1st order streams) and may be better drained. It is also wise to assess wether the vector stream network is geomorphologically valid with reference to the law of stream drops (Broscoe 1959) by using the Stream Order vs Stream Drop and Stream Area Threshold Comparison charts.
