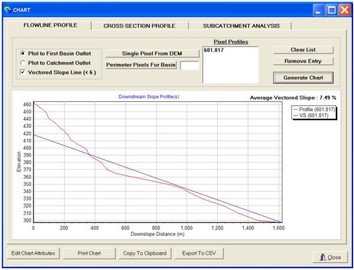
The longitudinal flow path profile charts the change in elevation over the length of a flow path originating from a pixel, as well as the average vectored slope of this profile (equal area above and below - between flowline profile and vectored slope line). To select one or more pixels for charting, click the Single Pixel From DEM button. This will cause the Chart form to disappear. Individual pixels can be added to the chart by clicking on the DEM and then clicking Finished when finished. To generate the chart select Generate Chart. The average vectored slope of the flow path profile(s) is shown above the legend. The flow path profile can be plotted to the catchment outlet or the subcatchment (basin) outlet depending on the radio button selection. The checkbox governs wether the vectored slope line will be displayed. There is also an option to display flow line profiles for all pixels on the perimeter of a subcatchment.
| Note: | The option to plot the vectored slope line will be disabled once 6 or more pixels are selected to reduce clutter in the chart. |
