CatchmentSIM includes tools and a Macro Wizard script to help apply the Probably Maximum Precipitation (PMP) estimates documented in the BoM Generalised Short Duration Method (GSDM) Documentation in order to model the Probable Maximum Flood (PMF). The derivation of PMP estimates requires the following steps:
1.Creating a roughness (Terrain Category Grid) grid
2.Creating and orientating the rainfall depth ellipsoids
3.Creating spatially varying grids of rainfall depth for each duration
4.Creating user variables reporting the average rainfall depth for each subcatchment and duration
5.Exporting IFD files that can be imported into Storm Injector (or other software) for modelling of the PMF
An example of applying the PMP GSDM approach is shown below.
CatchmentSIM Project
In this example, a CatchmentSIM project has been setup for Sorell Creek in Tasmania. As shown below, a number of subcatchments have been delineated and the project is now ready for hydrologic modelling. CatchmentSIM can be used to generate PMP estimates for each subucatchment.

CatchmentSIM Project
Roughness Grid and Spatial Patterns
The first step is to click on the PMP (GSDM) button on the Analysis toolbar. This will bring up the Spatial Distributions Patterns form as shown below.
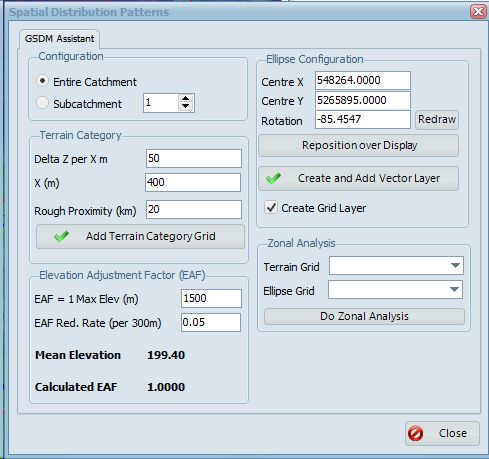
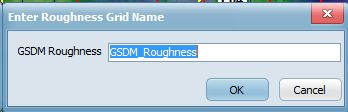
The next step is to create a Terrain Category Grid using the Add Terrain Category Grid button. This creates a grid representing how rough the terrain is for the purposes of the GSDM approach. The Terrain Category parameters can be modified as needed. After clicking the Add Terrain Category Grid button you will be prompted to define the name of the resultant grid.
After CatchmentSIM has finished processing, you should notice a roughness layer within your project. The next step is to place the GSDM spatial patterns. You may have noticed that CatchmentSIM has already attempted to place and orientate the GSDM ellipsoid patterns over the catchment.

PMP Ellipses
These can be re-positioned if needed using the Rotation and Reposition over Display options. The positioning of these ellipses should attempt to fully contain the catchment within the smallest ellipse possible while ensuring the centre ellipses are positioned over the catchment where possible. When you are finished positioning the ellipses, click Finished.

Moving PMP Ellipses
Once you are happy with the positioning of the spatial patterns, click Create and Add Vector Layer. This will add a vector layer and raster grid associated with the spatial patterns to the project.
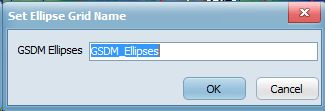
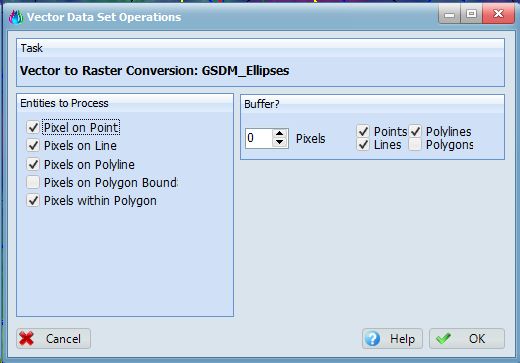
You will be prompted for a GSDM Ellipse layer name and vector to raster conversion settings. The defaults should be sufficient in both cases.
At this point, you should see the GSDM ellipses in your project as both vector and raster layers. You can now close the Spatial Distribution Patterns form.

PMP Ellipses Complete
PMP Depth Grids, Worksheets and Subcatchment Averages
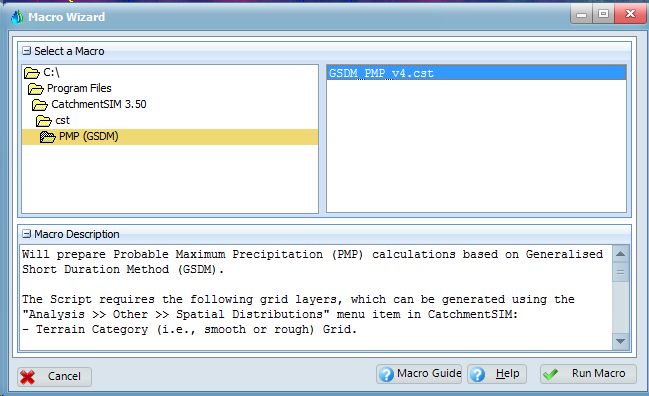
The next stage of the workflow is to create depth grids, reports, average subcatchment PMP depths and IFD files for Storm Injector via a Macro Wizard script in the PMP GSDM directory. From the Export toolbar, select Run Macro Wizard and run the latest version of the PMP_GSDM script from the PMP (GSDM) folder. A minimum of version 4 is required for the features described in this example.
You will be prompted to select an export location for the GSDM worksheet. Enter the desired file name and click Save. You will also be prompted for the Catchment Name.
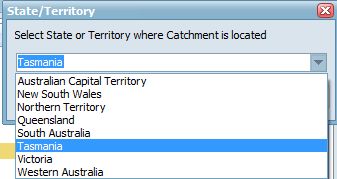
You will also be prompted for the State or Territory.
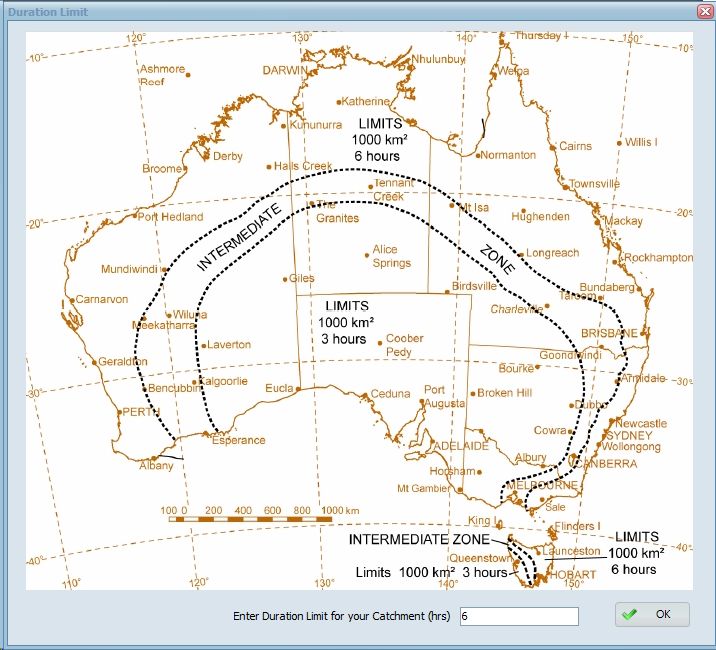
You will next be prompted to enter the duration limit based on the image below. In this case, 6 hours is appropriate.
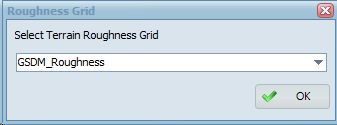
You will then be prompted to select the Terrain Roughness grid created in the previous step.
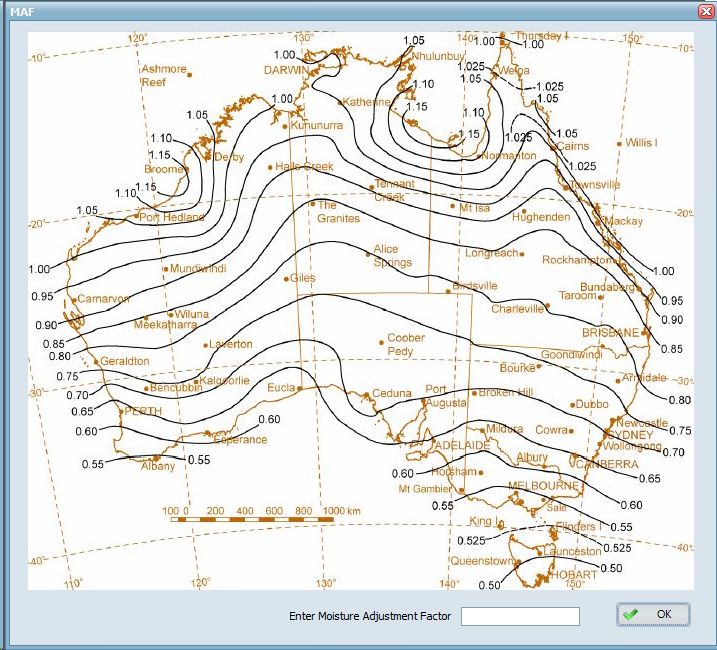
After some processing, you will be prompted to enter the Moisture Adjustment Factor (MAF) based on the image below. In this case, a MAF of 0.5 can be used. From CatchmentSIM 3.63 (and GSDM_PMP_v8.cst), the MAF can be automatically calculated from the EPWannual / 104.5 grid which can be downloaded in either the GSAM or GTSMR Grid packages from our website.
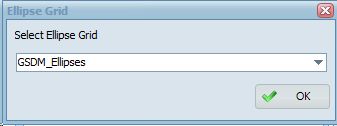
You will then be prompted to select the Ellipse grid created in the previous step.
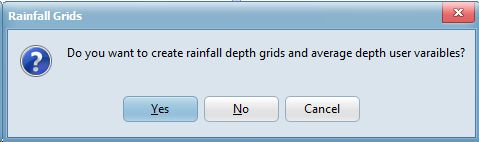
You will then be prompted if you wish to create depth grids and average depth user variable. Click Yes.
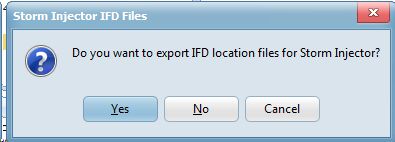
You will also be prompted to export IFD Location files for Storm Injector. Click Yes.
This should conclude the PMP GSDM script.
You should notice that CatchmentSIM has created a raster grid for every duration up to the Duration Limit for the PMP based on the GSDM procedures. These grids could be exported and used as inputs for direct rainfall grids or their values will be averaged for each subcatchment for subcatchment based models.

PMP 6hr Depth Grid
If you open the Subcatchment Manager, you will also notice that user variables have been created for each duration showing the average weighted PMP depth based on Zonal Statistics of these grids.

Subcatchment Manager
If you wish, these user variables can also be visualised by thematic mapping of the subcatchment boundaries.

Thematic Mapping of Subcatchment Average PMP Estimates
You will find a Rich Text File (*.rtf) version of the GSDM worksheet has been written to the file you selected in the previous step. This report is formatted in accordance with GSDM procedures. A PDF version of the worksheet created for this example can be downloaded here.

GSDM Worksheet
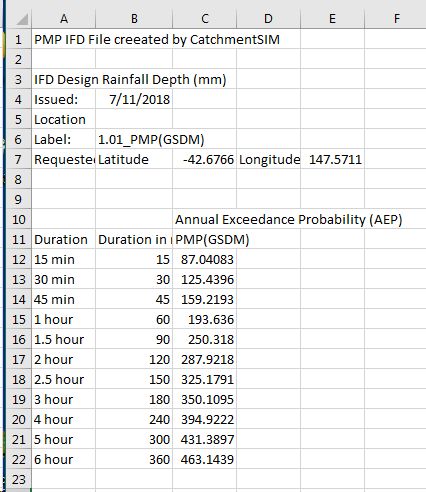
You will also find a series of IFD CSV files exported to the same directory that can be imported into Storm Injector. An example of the IFD file for the first subcatchment is shown below.
The next part of this example will document how this information can be used in Storm Injector to produce a spatially varying PMF hydrologic model.
PMP in Storm Injector
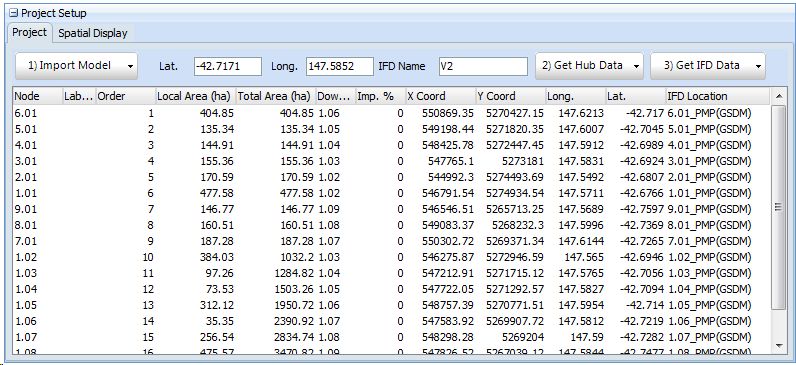
The first step in Storm Injector is to import a model. This can be a WBNM, RORB, URBS or XP-RAFTS model that has been exported by CatchmentSIM and then updated or calibrated. For this example, we will use a WBNM file that was exported from CatchmentSIM using the WBNM macro wizard script as outlined on the WBNM page.
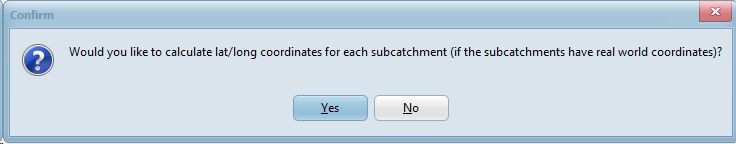
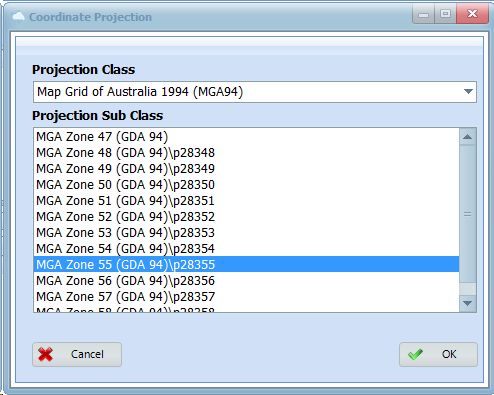
Click 1) Import Model >> WBNM and select the SorellCreek.wbn file. When prompted to calculate lat/long coordinates, click Yes and select Map Grid of Australia 1994 >> MGA Zone 55.
At this point, you can click 2) Get Hub Data to download the ARR Data Hub information based on the average latitude and longitude of the imported subcatchments.

ARR Data Hub Download
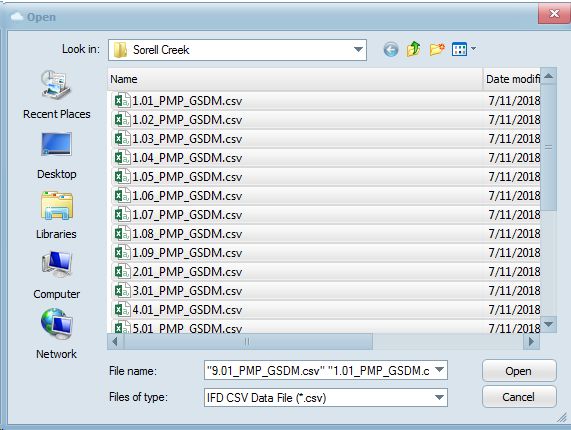
Click Ingest Data to complete the download. The next step is to import the IFD information for the PMP exported from CatchmentSIM. This can be done using the drop down arrow next to the 3) Get IFD Data button and selecting Import IFD(s) from csv. Then group select all the IFD files and click Open.
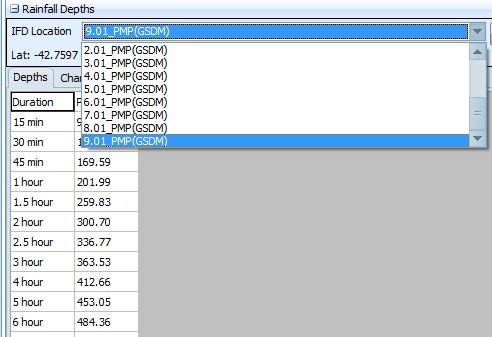
You should now see all the IFD Locations imported into the Rainfall Depths panel in Storm Injector.
The next step is to assign the relevant IFD locations to each subcatchment. This can be done by selecting the drop down arrow next to 3) Get IFD Data and selecting Assign closest IFD locations for subcatchments >> using lat/long. After this, you should see that the IFD Location column should reflect the IFD File for each subcatchment. For example, Node 6.01 has an IFD Location of 6.01_PMP(GSDM) and so on. This is how the PMP depths are spatially assigned.
The GSDM PMF is modelled in Storm Injector using a custom event. The easiest way to enter the specific code is by right clicking on the Custom Events field and selecting the PMF example as shown below.

PMP Custom Event Setup
This will enter some example code in the Custom Events field which can be used by default. However, more information on the custom event code parameters for the PMF can be viewed in the Storm Injector help file.

Click 4) Create Storms to generate the specific design storms for the PMF. You should see that a row has been created in the Storms panel for each duration of the PMF.
Click 5) Prepare Model Runs and select the SorellCk.wbn file for creation of the PMF run files.
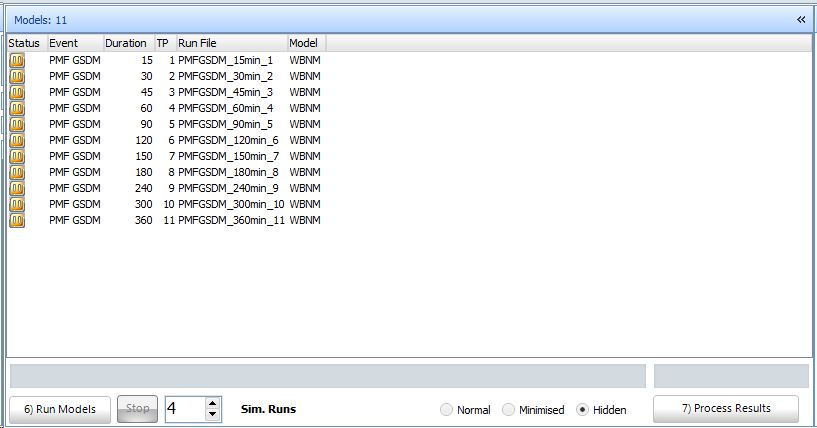
Click 6) Run Models and then 7) Process Results. At this stage, you can view to tabular results, Box plots or hydrograph charts.
This completes the CatchmentSIM and Storm Injector PMP GSDM example.

Box Charts

Hydrograph Charts