Overview
The 'Normal Depth Along Stream' menu item will calculate flood levels, floodwater depths and flow velocities along all vector streams in the project area using a normal depth (i.e., Manning's) calculation. In order to use this feature you must have a raster grid specifying the variation in Manning's 'n' roughness coefficients across your study area (refer to Raster Calculator Code Examples for information on how this can be completed) and a raster grid describing the variation in peak discharge across your study area (the Probabilistic Rational Method raster calculator scripts can be used for this purpose). You must have also generated a vector stream network by selecting Flow Mapping >> Generate Streams (the normal depth calculations are only performed on pixels that are traversed by a vector stream). It should be noted that this facility is not intended to replace a detailed hydraulic model and should only be used to provide an initial assessment of areas of potential floodwater inundation/ flood hazard.
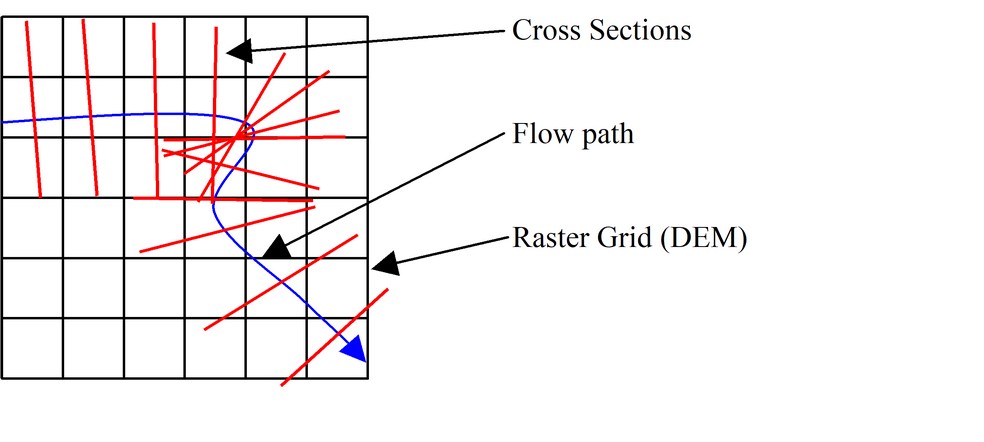
CatchmentSIM extracts cross sections from the raster DEM at each cell along a vector flow path and at user defined increments along curves, as shown below. Peak discharges and Manning's 'n' values at each DEM cell are extracted from user-defined grid layers and an average slope between adjoining DEM cells is calculated automatically using the DEM elevations and flow path length between DEM cells. This information is used to solve Manning’s equation iteratively. The flood depth, level and velocity calculated for each inundated cell is recorded and written to new raster grid layers, which are automatically added to the CatchmentSIM project.

The cross-sections are initially generated at a width of 3 DEM cells on both sides of the flow path alignment. The cross-sections are widened if necessary based on the following criteria:
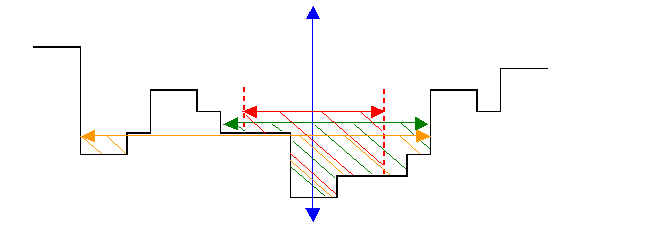
Once the iteration has reached closure and the correct water surface elevation has been determined, the algorithm will check to ensure that the left and right overbank elevations in the cross-section are higher than the calculated water surface. In many cases, the narrow initial cross-section will result in a surface water that is not constrained by left and right overbank elevations resulting in a excessively high water level (due to the invisible 'vertical walls' assumed at ends of cross-section). This is demonstrated by the red cross-section shown below. In this case the cross-section is widened by one DEM cell on both sides and the surface water level is re-calculated. This is repeated until the surface water level is constrained within left and right overbanks similarly to the green cross-section shown below or until the maximum cross-section width (user defined) is exceeded. This iterative procedure is undertaken since starting with an excessively wide cross-section can result in excessive flow splitting as demonstrated in the orange cross-section shown below. This method is designed to ensure the flow is not split between multiple channels and the potential for hydraulic structures (e.g., kerbs and gutters) to constrain flow and avoid inundation of low-lying areas that may be separated from the main conveyance channel by a section of higher ground.

Once a water surface elevation is determined that is constrained by higher elevation left and right overbank areas, the inundated DEM cells covered by the cross-section are recorded along with the water surface elevation, depth of inundation and flow velocity. Once the analysis is complete, CatchmentSIM produces raster datasets for water level, depth and velocity for the entire project area.
Using the Normal Depth Calculator
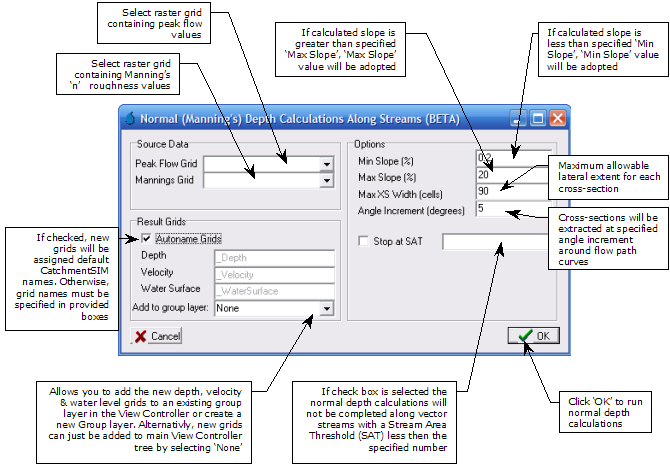
An overview of each component of the 'Normal Depth Along Streams' form is provided below. As discussed, in order to use the normal depth calculator it is necessary to have raster grid layers describing the variation in Manning's 'n' values and peak discharges across the study area. Both of these grids can be developed using the Raster Calculator. The Manning's 'n' and peak discharge grid layers are the only items required in order to use the normal depth calculator. The remaining items in the 'Normal Depth Along Streams' form can be modified if required, but in most circumstances the default values should generate reasonable results.

