The "Rainfall" page of the GSSHA interface, which is shown below, allows you to define the temporal and spatial distribution of rainfall across your catchment. Rainfall can be specified as a constant intensity and duration over the entire catchment (useful for testing) or a temporally and spatially varying rainfall using up to nine rainfall gauges.
import recorded rainfall information
For this simulation we have 60 minute rainfall information for four rainfall gauges scattered across the catchment. As we have more than one rainfall gauge and we have time-varying rainfall information, we need to select the 'Spatially / Temporally Varying' radio button near the top of the page.
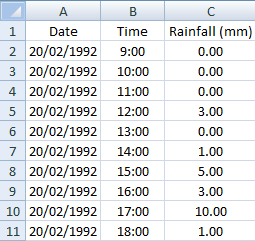
Now move to the 'Temporally / Spatially Varying Rainfall Input' section of page (about half way down). Change the 'Number of Rainfall Gauges' to '4'. You should see four tabs appear (i.e., one tab for each of the four rainfall gauges). Temporally (i.e., time) varying rainfall information for each gauge can be input directly in the GSSHA interface table or imported from an Excel spreadsheet (ensuring the spreadsheet adheres to the following format):

As shown above, the first column must contain a header row followed by the date in dd/mm/yyyy format. The second column must contain the time in 24 hour format and the third column must contain the rainfall value. An example of the required file format can be found in the 'RainfallData' directory. It is also important that all rainfall gauges have the same time steps and start/end time for all gauges. The time step can vary throughout the simulations, however, cannot vary between gauges. For example, you can have large time steps where there is little of no variation in rainfall and then smaller time steps when there are large variations. However, each gauge used in the simulation must use the exact same time steps (this can be partly verified in Excel by comparing the start and end dates as well as the number of rows in each rainfall data file).
Enter the appropriate data for each gauge using the information contained in the following table. The order in which you enter the information is not important.
Name |
Malaney |
Imbil |
Jimna |
Gympie |
Easting |
483430 |
468430 |
446929 |
466697 |
Northing |
7039397 |
7074441 |
7050372 |
7102124 |
Rainfall Data File |
..RainfallData/MalenyRainfall.xls |
..RainfallData/ImbilRainfall.xls |
..RainfallData/JimnaRainfall.xls |
..RainfallData/GympieRainfall.xls |
Once you have loaded in all the rainfall, you can graph all (or some) or the rainfall data by clicking the ' ' button. The chart should look similar to the following:
You can turn the data for the various gauges 'on' or 'off' by checking and unchecking the gauge names in the legend in the legend near the top right of the chart. The chart image can be saved to file by clicking the ' ' button, copied to the clipboard by clicking the '
 ' button or printed by clicking '
 ' button. Clicking the '
 ' button will enable you to modify the appearance of the chart and export all the information contained in the chart to a text file or an Excel spreadsheet.
Although an historic event is used for this example, design rainfall information could also be input using a suitable temporal pattern. For larger catchments, different Intensity-Frequency-Duration information could be sourced for different sections of the catchment allowing application of a spatially and temporarily varying design storm.
For this project, we are assigning rainfall information for four point rainfall sources (i.e., rainfall gauges). Therefore, it will be necessary for GSSHA to apply an interpolation routine to assign rainfall values to grid cells that are not located at these point locations. GSSHA can apply either an 'Inverse Distance Weighted' or 'Thiessen Polygon' interpolation routine. For this example, we will retain the inverse distance weighted interpolation routine, so ensure that this radio button is selected near the bottom of the page.
The completed 'Rainfall' page should look similar to the following:


