In order to run a GSSHA simulation, it is necessary to setup a new CatchmentSIM project, create a new DEM and condition the DEM. These are steps that would be performed when developing any CatchmentSIM project. Nevertheless, this process is outlined below.
SETUP Project
Start by creating a new CatchmentSIM project (CatchmentSIM Drop Down >> New). Specify a suitable file name and save location by clicking the 'Browse' button. It is suggested the project be saved in the input data directory for Tutorial 5, if possible.
Now specify a projection of 'Map Grid of Australia 1994 (MGA94) - MGA Zone 56' for the project.
Next enter in the following design plane coordinates:
Xmin: 433750
Ymin: 7029970
Xmax: 491650
Ymax: 7119250
The completed New Project window should look similar to the following:
Now click the "OK" button to close the New Project window.
Create digital elevation model (dem)
Now a new DEM must be developed and elevation values must assigned to each DEM cell. The resulting elevation grid is one of the primary inputs to GSSHA.
To setup a new blank DEM, select Create DEM >> Setup Blank DEM. Specify a square grid size of 300 metres, as shown below. This will create a blank DEM where each grid cell measures 300 x 300 metres in size.
The DEM cell size (and, therefore, DEM file size) greatly impacts on the GSSHA simulation run time. Therefore, the cell size should be kept as large as possible while still providing a reliable representation of the spatial variation in hydrologic parameter values. As a general guide, a DEM file size less than 0.5 MB, will typically provide fast run times while still providing an improved representation of the spatial variation in hydrologic parameter values relative to traditional lumped models.
Now it is necessary to assign elevation values to each grid cell in your catchment (all the DEM cells currently have no elevations assigned). Elevations can be assigned using a variety of topographic data formats, including:
•GIS Contours;
•Raster DEM;
•TIN DEM;
•Spot Heights; or,
•LiDAR.
For large catchments, there are several freely available topographic datasets that can be used to assign elevations. This includes:
•NASA Shuttle Radar Topography Mission (SRTM) data, which provides raster elevation information for most land around the world at a 90 metre raster grid size. This information can be downloaded for free from NASA from the following page: http://dds.cr.usgs.gov/srtm/version2_1/SRTM3/; and,
•Advanced Spaceborne Thermal Emission and Reflection Radiometer (ASTER) Global Digital Elevation Model (GDEM) provides elevation information for all land on earth at a 30 metre grid resolution. This information can also be downloaded for free from the following page: http://www.gdem.aster.ersdac.or.jp/. However, we have found the quality of this dataset to be poor in some areas of Australia.
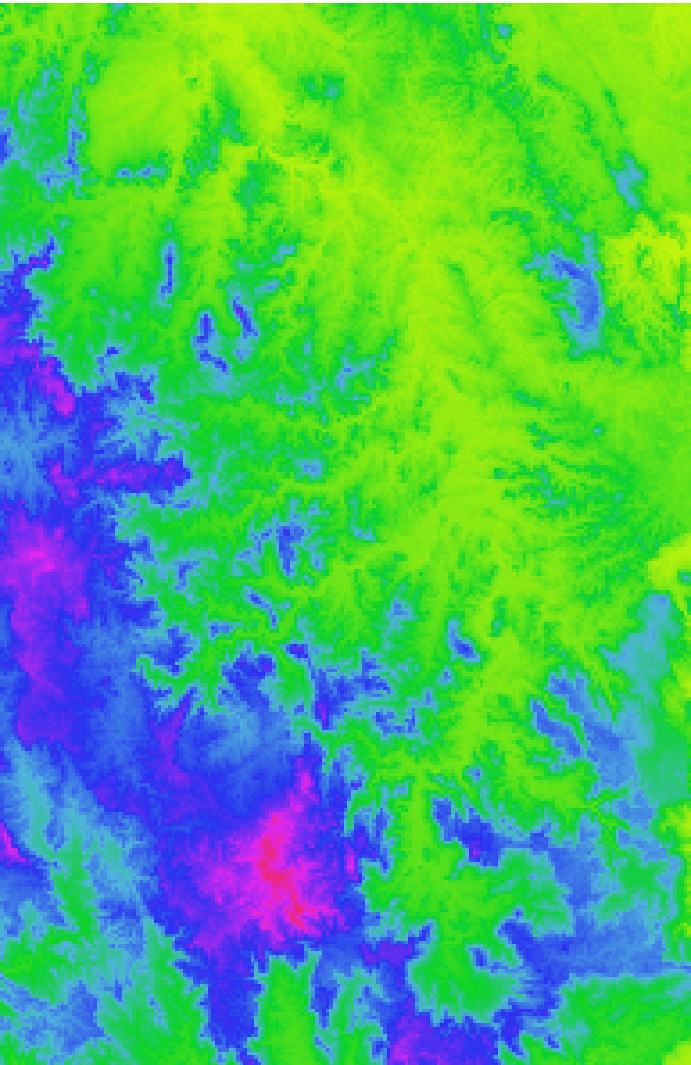
For this example project, SRTM data will be used to assign elevations values. To sample the SRTM information, select 'Create DEM >> Raster DEM' and then navigate to the Tutorial#5 data folder and then into the SRTM folder. You should find a 'S27E152.hgt' file. Select this file and click 'Open'. CatchmentSIM should sample the elevation information from the SRTM file and the resultant DEM should look similar to that shown below:

condition dem
Finally, the raw DEM that we have just created must be conditioned so that flow paths can be mapped from all sections of the study area. This is necessary to:
•Map a reliable catchment boundary. This is important for ensuring the correct catchment area is draining to any point within our study area.
•Map reliable streams. This is important when using a 1-dimensional stream network as it impacts on the length of the 1-D stream network, which in turn, impacts on the routing of the discharge hydrographs throughout the catchment.
•Improved convergence. Ensuring all flat and pit pixels are removed from the DEM will help improve model stability.
The DEM can be conditioned using the Breaching Algorithm. Open the Breaching Algorithm by selecting 'DEM Conditioning >> Breaching Algorithm'. Retain the default input parameters and click the 'Process Entire DEM' button.
You should now be able to map the flow from all sections on the DEM. The majority of the DEM should drain towards the Pacific Ocean, which is located near the right edge of the screen. To map flow paths select 'Flow Mapping >> Map Pixel Flow Path' and left click at various location on the DEM.
![]()
Assuming the flow paths drain all drain towards the edges of the screen, you should now be ready to map your catchments and stream network.

