
Storm Injector Help
The SorellCk_test.wbn file is distributed with WBNM 2017 and includes many storms to give an example of the range of ARR 2016 functionality within WBNM. The storm considered most relevant for verification was Storm 10 which was labelled:
1% AEP Dura and Pattern Spectrum - Losses calc - ARF calc
That is, this storm was the 1% AEP event with automated calculation of ARF and initial losses.
Input Data
A revised version of the wbn file was created with only this storm included (now storm 1). This file was called SorellCk_Storm10.wbn. The file referenced the following input data files:
•SorellCk_Catchment.txt - An extract from the ARR Data Hub (ARR Data Hub Format)
•Southern_Slopes_Tasmania_Increments.csv – IFD data for 3 gauges (WBNM format)
•Southern_Slopes_Tasmania_Increments.csv – temporal patterns (ARR Data Hub Format)
Completing the Project in WBNM
When running this file in WBNM 2017, the following results are generated:
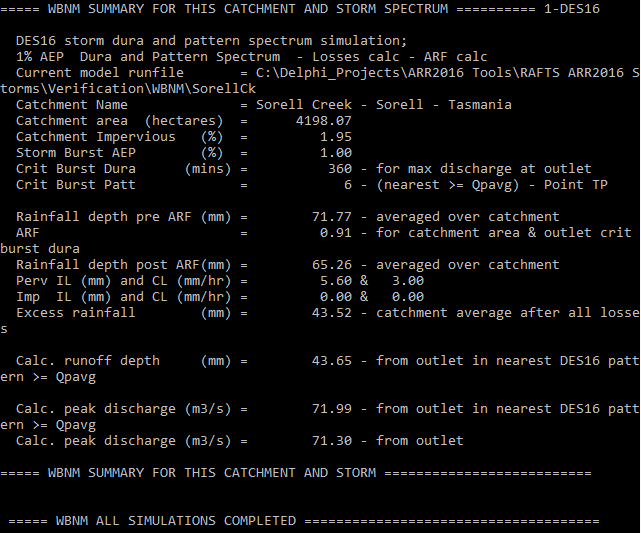
As shown above, the results are:
•360 min (6 hr) storm duration is deemed critical
•The ARF is 0.91
•The initial loss is 5.6mm
•The calculated peak discharge is 71.3 m3/s (average of all 6hr temporal patterns)
•The peak discharge of the adopted temporal pattern is 71.99 m3/s
The next section documents the steps to replicate these results using Storm Injector.
Completing the Project in Storm Injector
1.Import the .wbn file using the 1) Import Model button. Click Yes when prompted to convert the projection and select MGA Zone 55.
2.We wish to utilise the same data as WBNM wherever possible. As such, instead of downloading the ARR Data Hub information, click ‘2) Get Hub Data >> load text file’. Then select the ‘SorellCk_Catchment.txt’ file. There will be some warnings about missing data which can safely be ignored.
3.The ‘SorellCk_Catchment.txt’ file did not include the temporal patterns so these need to be manually imported. Right click on the grid in the Point (2016) Tab of the Temporal Patterns panel and select Import TPs and select the ‘Southern_Slopes_Tasmania_Increments.csv’ file.
4.The IFD data is a specific format to WBNM and cannot be read by Storm Injector. However, the same data can be loaded automatically downloaded from the BoM IFD page. For this project, import the IFDs from csv files that have previously been downloaded. Click the 3) Get IFD Data >> Import ARR 2016 IFD(s) from csv option and select the 3 IFD files SorellCkTop_IFD.csv, SorellCkMid_IFD.csv and SorellCkBot_IFD.csv. It can be seen that the IFD values for the 1% AEP 6hr storm for the top, middle and bottom gauges match the WBNM file exactly being 75mm, 72.6mm and 63.4mm.
5.Assign subcatchments their closest IFD Location using 'Assign closest IFD for locations for subcatchment >> using project coordinates'. This is important since unless IFD Locations are assigned to at least one subcatchment, they will not appear in the Storms grid and will not be used in the modelling. However, ultimately, the weighting of the gauges will be overridden by the WBNM internal weighting.
6.To ensure consistency with WBNM, on the Settings tab ensure 0 is set for both the Impervious Initial Loss and Impervious Continuing loss. Also check the ‘Use WBNM Calc_RainGauge_Weights’ option in the WBNM Settings tab. This will allow WBNM to use its internal Thiessen Polygon rainfall weighting in preference to any IFD gauge assignments made in the Project Setup tab.
7.Click the 1% AEP rare event in the Selected Events panel.
8.Click ‘4) Create Storms’.
9.Click ‘5) Prepare Model Runs’.
10.Click ‘6) Run Models’.
11.Once the runs are complete, click ‘7) Process Results’.
An exert of the tabular results for the bottom subcatchment are shown below.
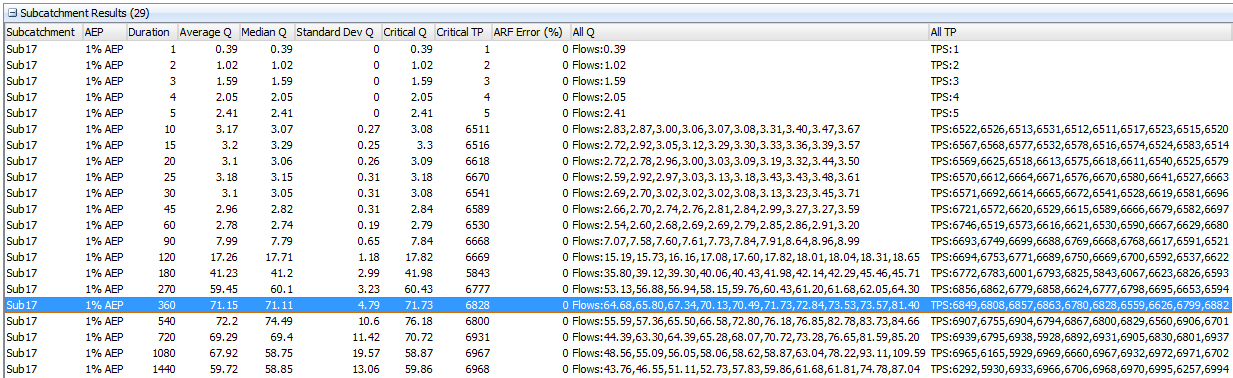
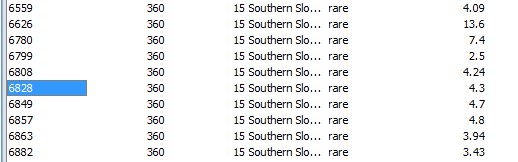
As shown, the 360 min (6 hr) storm generates a peak for the adopted temporal pattern of 71.73 m3/s (vs 71.99 for WBNM) which is within 0.3%. It seems that WBNM and Storm Injector also agree on the critical temporal pattern with is reported as 6828. WBNM reports this as the Critical Burst Patt of 6. Temporal pattern 6828 is the 6th pattern in the 360 min rare temporal patterns.
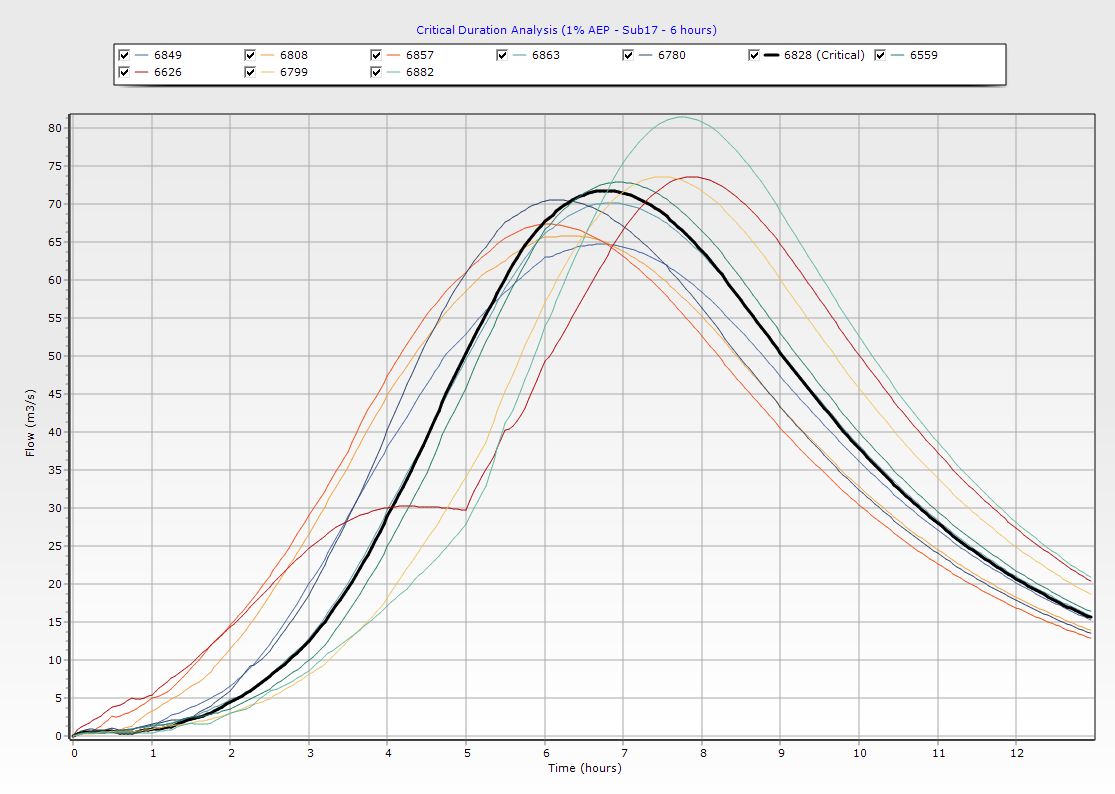
The 360 min 1% AEP hydrographs are shown below.
As an aside, it is noted that Storm Injector finds the 540 min (9 hr) storm generates a higher critical flow of 76.18 m3/s. This can be seen in the box charts which are shown below for the 2hr – 24 hr 1% AEP event.
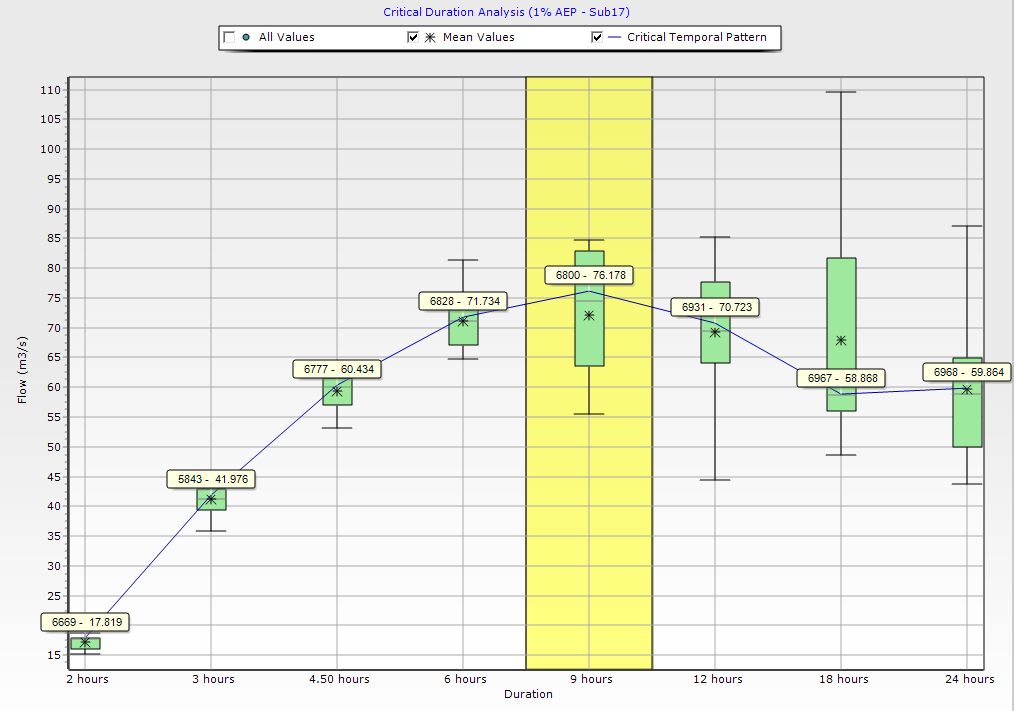
After analysis of the WBNM files, it seems that the 540 min IFD information was not included in the ‘Southern_Slopes_Tasmania_Increments.csv’ file. This is likely because this is a non-standard duration and is not displayed by default on the BoM IFD webpage. However, this duration is included in the Data Hub temporal patterns. Storm Injector includes these non-standard durations by default when downloading IFD data.
USE OF CURRENT DATA HUB INFORMATION
A new Storm Injector project was undertaken without using any of the source data included with the SorellCk WBNM project. The steps were:
1.Import the SorellCk_storm10.wbn file and convert to lat/long
2.Select all rows and download IFD Locations for each subcatchment (17 IFD Locations)
3.Assign IFD locations to closest subcatchment (each subcatchment will have its own IFD Location)
4.Select the 1% AEP rare event
5.Generate Storms
6.Prepare Models
7.Run Models
8.Process Results
The peak of the critical temporal pattern for the 360 min storm was 64.95 and for the 450 min was 68.99. These values are approximately 10% lower than the base case. This is thought to be mainly due to the continuing loss value of 4 which was obtained from the ARR Data Hub download from the centre of the project coordinates -42.7311, 147.5792 versus a value of 3 in the ‘SorellCk_Catchment.txt‘ file. If the pervious continuing loss is overridden in the Setting tab with a value of 3, the results for the 360 min and 450 min storm are 75.35 and 78.05 respectively. This is approximately 5% more than the base case. This is thought to be due to lower initial losses since the Storm Initial Loss in the revised Data Hub is 27mm vs 30mm in the ‘SorellCk_Catchment.txt‘ file. Furthermore, the median prebust differs slightly from 24.8mm vs 24.4mm in the ‘SorellCk_Catchment.txt‘ file. If the initial loss is overridden in the settings tab to 30.4mm (to ensure a 1% AEP of 5.6mm, 30.4 – 24.8) then the results for the 360 min and 450 min storm are 72.46 and 77.33 respectively. This is a difference of 1% of the base case which is thought to be due to the additional IFD Locations used in the analysis.
