|
Exercise 1 – Cooper Creek WBNM – ARR2019 Ensemble, Extreme Event Rainfall Interpolation |
Scroll Prev Top Next More |
Summary
This exercise involves modeling spatially varying design rainfall for a catchment in north-east NSW using the Cooper Creek WBNM project. A critical duration analysis is performed and then design flows for a full range of AEPs are determined.
An example of applying a climate change scenario using recently released ARR guidance is also provided.
Following, this extreme event rainfall interpolation is undertaken based on GSDM PMP estimates and these are then used to define flows for events up to the 1 in 10 million year AEP.
Two projects will be created which will both be compared with Monte Carlo analysis in Exercise 2.
The data for this exercise can be download from the links at Advanced Exercises.
Instructions
1.For this exercise, please adopt the following settings from the settings tab (they should be selected by default for new users):
a.Burst Initial Loss Calculation - Probability Neutral Burst Initial Loss
b.uncheck 'Smooth patterns to remove embedded bursts'
c.uncheck the 'Inject pre-burst at start of temporal pattern'
d.ensure no rainfall loss overrides are set

Settings
2.In the Storm Generator Tab, Import the project CoopersCk.wbn using 1) Import Model >> WBNM
3.Convert coordinates to MGA Zone 56 (click Yes, then select Map Grid of Australia 1994 (MGA 94) and then MGA Zone 56). You should note that coordinates are calculated for all subareas and an area weighted centroid is populated in the main Lat and Long fields.

WBNM Subareas
4.Get Data Hub Data using 2) Get Hub Data and then Ingest Data
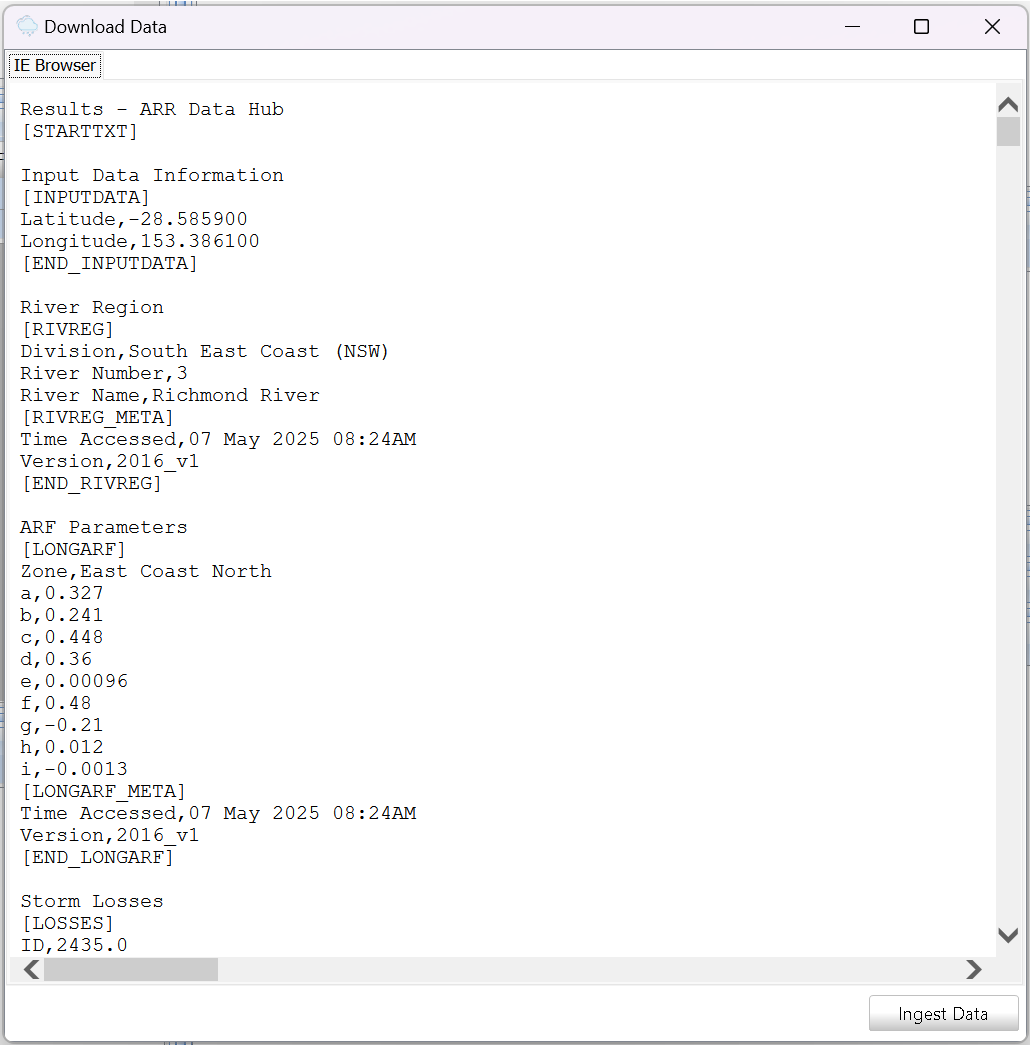
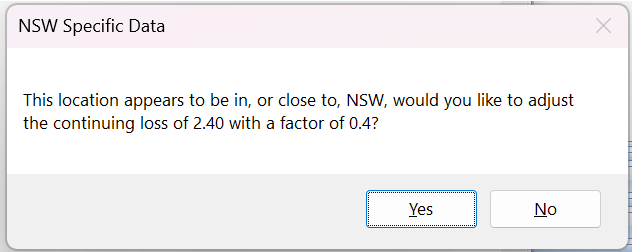
Apply the NSW Specific Data by adjusting the continuing loss of 2.40 with a factor of 0.4
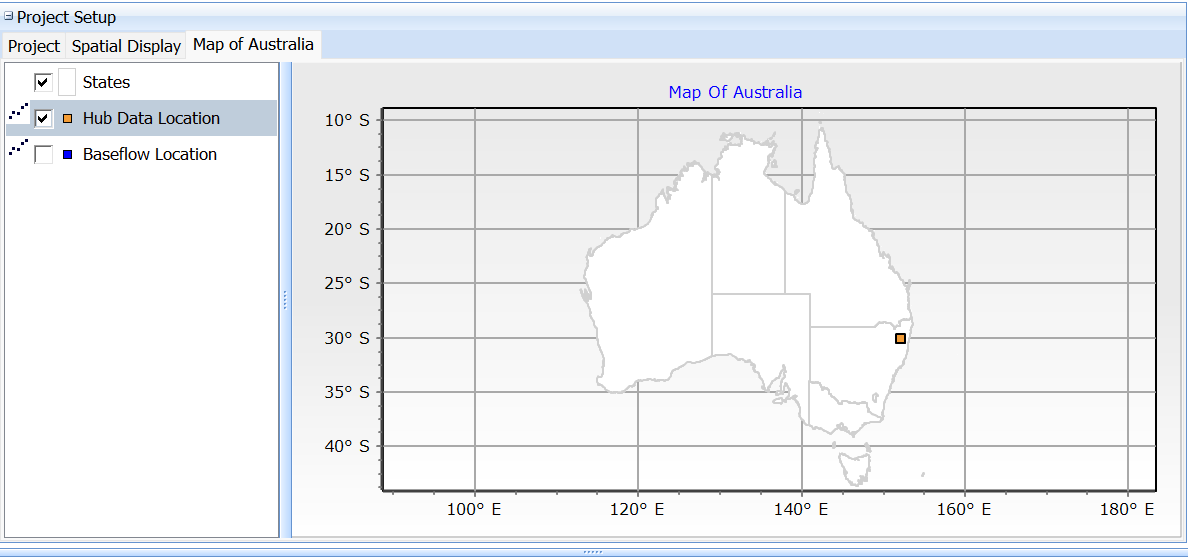
You can also view the location of the project in the "Map of Australia" tab in the Project Setup panel (or even download Data Hub info for a different location via right click).
5.Identify multiple locations for IFD data download using the Spatial Display tab.
Select multiple reference locations for IFD data — e.g., subcatchments 1.03, 27.01, and 34.02

Selecting IFD Locations
6.Select the appropriate rows in the subareas section (use ctrl key to multiple select) and download ARR 2016 IFD Data using the drop arrow on button 3) Get IFD Data >> Download ARR 2016 for selected rows.

Download IFDs at Selected Locations
Storm Injector will download all IFD Locations automatically.

Download of IFD Data
7.You will be prompted to assign IFD locations to subareas based on lat/long coordinates, click Yes. Alternatively, you can access this option from the drop-down menu on 3) Get IFD Data >> Assign closest IFD locations for subareas >> lat/long.

Assign IFD Locations
If you look at the spatial display, the subareas have been colour-coded by their assigned IFD locations. You may need to un-check "Show subcatchment labels"

Spatial Assignment of IFDs
8.You will also need rare and frequent IFD datasets. Click the button '3) Get IFD Data' drop arrow, then 'Download other IFD types for all IFD locations >> Frequent IFD' and then repeat for Rare IFD, in order to get all necessary rainfall data.

Fetching other rainfall data
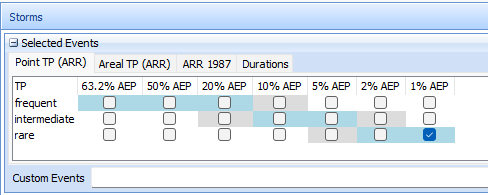
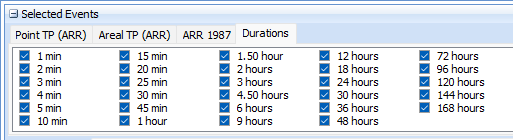
9.Firstly, let's do a critical duration analysis. Select the 1% AEP event in the Point TP (ARR) tab. Check the Durations tab and ensure the full range of durations are selected.
10. Click 4) Create Storms
11.WBNM can give routing errors if the Routing Increment is too large. Open the Routing Increments tab, set 10 min and the Max Inc (min) field and click Recalculate

Routing Increments
12.Switch to 'WBNM (Internal)' in the combobox near Button 5 to use the new internal WBNM engine. This means that you do not need to download WBNM or manage all the output files from the simulations, everything is stored within the Storm Injector project file.
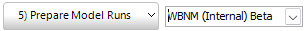
13.Click 5) Prepare Model Runs and select the same file, 'CoopersCk.wbn'
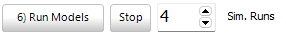
14.You should see the 240 models added to the Model Runs table on the Model Runs tab. Click 6) Run Models. You may wish to set the number of simultaneous runs based on the number of cores in your computer for performance optimisation.
15.Once the runs are complete, results may be auto-processed. If not, Click 7) Process Results.
16.Click Box Charts and click Chart in the Compare Durations panel. You should see that it defaults to the catchment outlet (1.26). The chart should indicate a critical duration of around 12 hours with a mean flow of ~690 m3/s and an adopted TP of 4787.

1% AEP Critical Duration Analysis
17.Now we will run a range of event AEPs for durations near the 1% AEP critical duration. As such in the Durations Tab, select 6 -18 hours. Right click options can be used to help do this quickly.

Reduced Duration Set
18.In the "Selected Events" panel, check IFDs and right click and select primary ensemble bins.

Standard IFD AEPs
19.Click on 4) Create Storms
20.Again, In the "Selected Events" panel, check the Rare option and right click and select primary ensemble bins. You can un-check the 1 in 100 event as we already have the 1% AEP event as part of the standard IFD AEPs. Importantly, click on the drop down of the Create Storms and select 'add to existing list of storms'. Otherwise, the standard IFD AEP events will be removed.

Rare IFD AEPs
21.You should see that 440 model runs are required to fully define the AEP range for these durations.

Storms for full AEP Range
22.Click on 5) Prepare Model Runs and then click 6) Run Models. Once the results are processed (Click button 7 if required). You may get a baseflow warning which you can ignore (click Yes) for this exercise. You should see results for all events populated. You can view ensemble results for all events by clicking Box Charts and then clicking Chart in the Compare Events panel

Compare Events
23.Save the project as ‘ex1-std-events.esi’ using the Save button.
1.Create Climate Change scenarios using Custom Events
a.Add a climate change scenario by navigating to the "Climate Change" panel on the Storm Generator tab. Right-click the 2090 row under the SSP2-4.5 scenario and select 'Create custom event >> 1% AEP >> rare'.

Creating Climate Change Events
b.You should see that custom event code is created and added to the the Custom Events text box in the Selected Events panel. This code defines the storm to be created and no check boxes are required to be selected besides the durations. Leave the duration settings , click the IFDs checkbox and uncheck all except the 1% AEP - rare option which will be used as a comparison to the climate change event.

Climate Change Storms
c.Click 4) Create Storms, 5) Prepare Model Runs, and 6) Run Models
d.After the simulation has completed and results are automatically processed, open the Box Plot panel to compare the peak discharge between the "1% AEP" (existing conditions) and "1% AEP-2.4-MMM-CC" (climate change scenario).

Climate Change Comparison for 1% AEP
e.You can also compare the hydrographs for the adopted temporal pattern in each ensemble using the Hydrograph Charts button and clicking Chart in the Compare Events Panel. Additionally, rainfall depth (mm) can be added into the hydrograph by checking the "Chart rainfall" button in the Chart Option Panel.

Hydrograph Charts Settings
f.Save as 'ex1-climate-change.esi'

Climate Change Hydrographs
2.Create Extreme Events
This exercise uses the new Extreme Event rainfall interpolation tools (ARR Book 8 Chapter 3) to define rare events.
a.Restart Storm Injector and create a new project. Import the WBNM model, convert the coordinates to lat/long and get the Data Hub information (Button 2) and accept the NSW jurisdictional advice.
b.Go go to Extreme Events tab
c.Click on 1) Import PMP Data. Navigate to the PMP Folder and Select all the PMP GSDM csv files. You should see the PMP csvs have been imported and their data can be viewed by clicking on a row in the All Locations table. On the right, you can see settings for the Area, PMP excedance probability (from ARR Fig 8.3.2) as well as the Extreme Event AEPs to be interpolated. This can be edited by right click.

PMP Datasets and Settings
d.Click on 2) Fetch BoM Rainfall, and the complete IFD data is populated under the "All AEPs" tab (including the interpolated rainfall depths between 1 in 2000 year and PMP). This has fetched all Bureau rainfall datasets for the selected locations, applied the ARF and interpolated the selected Extreme Event rainfall based on the settings.

IFD Data with Extreme Events
e.Click on 3) Sync to Storm Generator
f.Go to the Storm Generator tab and you can see in the Rainfall Depths, that new IFD Locations have been created with the '#A' suffix. This indicates than an ARF has already been applied. Thus, the Apply ARF checkbox should be turned off when using these IFD Locations (Storm Injector should warn you if you forget this).

New Rare ARF Applied IFD Location
g.In order to apply these to the subareas, use the arrow on Button 3) Get IFD Data >> Assign closest IFD .... >> using lat/long. You can confirm this assignment in the Spatial Display.

IFD Location Map
h.Since this is a GSDM PMP dataset, the longest duration we can apply is 6 hours. Only select 6 hours in the Durations tab in the Selected Events panel.
")
Selected Duration (6 hours)
i.On the Point TP (ARR) tab, right click and 'select primary ensemble bins'. Click 4) Create Storms. You may be reminded to turn of the Apply ARF checkbox. There may be a warning about missing durations which is a bug, click OK.
j.If you click on the Rare checkbox in the Selected Events panel, you should now see the new extreme events added as checkboxes (1 in 10,000 to 1 in 10 million). Right click and 'select primary ensemble bins', then un-check the 1 in 100. Click the arrow on 4) Create Storms and 'add to existing list of storms'.

Storms for Standard to Extreme AEPs
k.Click 5) Prepare Model Runs and then 6) Run Models. Once processed, you can compare the events using Box Charts and clicking Chart within the Compare Events panel. You can also click the 'Plot X as Log AEP (1 in X ) Years' option.

Tabular Results for Extreme Events

Box Charts for Extreme Events
l.Save your project as "ex1-extreme-events.esi"