The Zonal Statistics form is used to analyse raster gird layers that are developed in CatchmentSIM. The grid layers will generally be developed using the Raster Calculator or the Create Grid from Layer tool. The Zonal Statistics form contains 2 pages; "Zonal Statistics" and "Categorised Zonal Statistics". Further details on each page are provided below.
Zonal Statistics
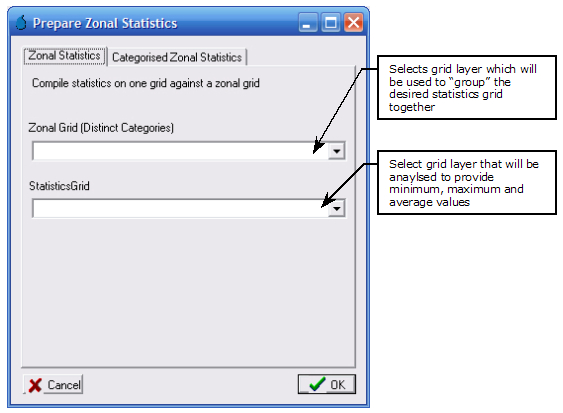
The Zonal Statistics form allows you to extract minimum, maximum and average values from a selected grid layer and group them based on another grid layer. The "Statistics Grid" drop down box is used to select the grid layer where the average, maximum and minimum values will be extracted from. The "Zonal Grid (Distinct Categories)" drop down is used to select a grid layer that will be used to group the average, maximum and minimum values according to distinct zones.
For example, you may wish to extract average runoff curve number or Manning's 'n' values for each subcatchment. In this instance you would need to have a 'Subcatchment ID' grid layer and a 'Curve Number' or 'Manning's n' grid layer. The 'Subcatchment ID' would need to be selected from the top drop down box as we are using this layer to group our curve number or Manning's 'n' statistics into distinct categories (i.e., by subcatchment ID numbers). Next the 'Curve Number' or 'Manning's n' grid layer would need to be selected from the bottom drop down box as this is the layer where we will actually be extracting the statistics (i.e., average, minimum and maximum values) from. If you select the 'Subcatchment ID' and 'Runoff Curve Number' grid layer, the Zonal Statistics form should look similar to the following after you click the "OK" button:
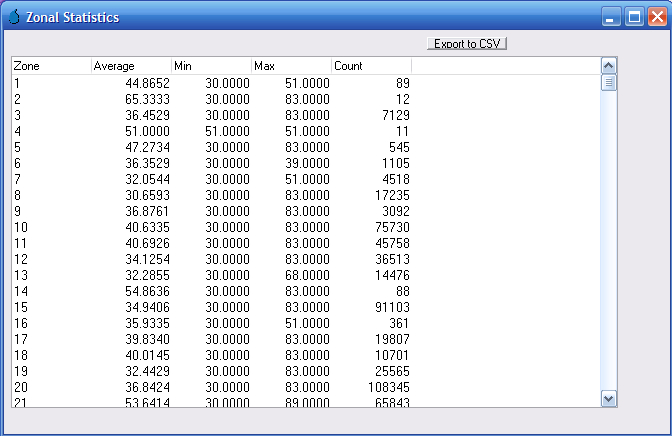
In the above table, the "Zone" column corresponds to all available distinct categories from the 'Subcatchment ID' grid (i.e., subcatchment ID numbers). The "Count" column lists the total number of grid cells from the 'Curve Number' grid that fall within each distinct zone. And the average, minimum and maximum values are the calculated curve number statistics for each distinct zone.
Please note that zonal grid values can be non-numeric, but the statistics grid must comprise numeric values to enable calculation of minimum, maximum and average values.
The values listed in the zonal statistics form can be exported to CSV file format for reporting or further analysis by clicking the "Export to CSV" button.
Categorised Zonal Statistics
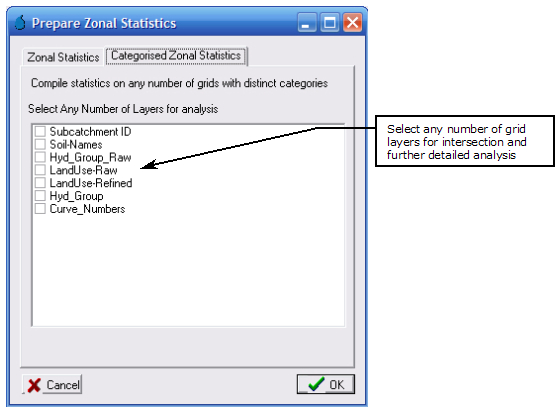
The Categorised Zonal Statistics form provides additional reporting and analysis capabilities (relative to the Zonal Statistics form) by allowing any number of grid layers to be intersected and analysed separately and in combination. All grid layers that are available for analysis within the CatchmentSIM project will be displayed along with a deselected check box. The grid layers that you would like to analyse must be selected by placing a 'tick' in the check box. Following selection of the grid layers, select the "OK" button.
CatchmentSIM will analyse each of the selected grid layers to develop a list of distinct categories. The list of all distinct categories will be displayed by default in a new form as shown below (for this example, we have again used curve numbers).
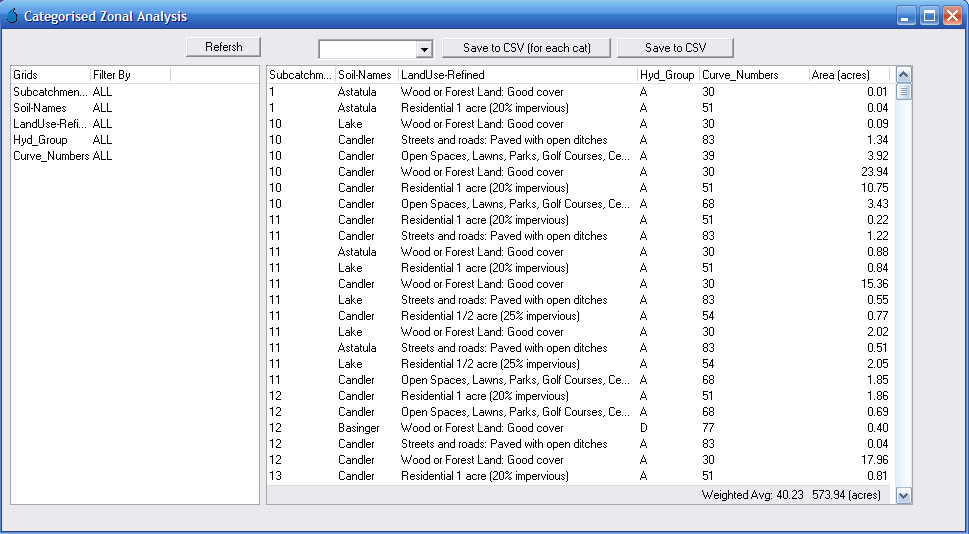
In the above form, CatchmentSIM has listed all the unique combinations of subcatchment ID, soil names, land use, hydrologic groups and curve numbers and has listed these along with the associated area in the main table.
By default, all available distinct categories are displayed in the table. To 'filter' some of this information you can choose to display only selected individual categories from any gird layer. To do this, click any desired row in the "Filter By" column on the left, this will display a drop down box that will enable you to select from any of the available unique categories. For example, if you only wish to review the curve numbers and associated unique categories for Subcatchment 22, then select 22 in the cell located to the right of 'Subcatchment_ID' and click the "Refresh" button. The table will be modified so that only unique categories that include Subcatchment ID 22 are included, as shown below.
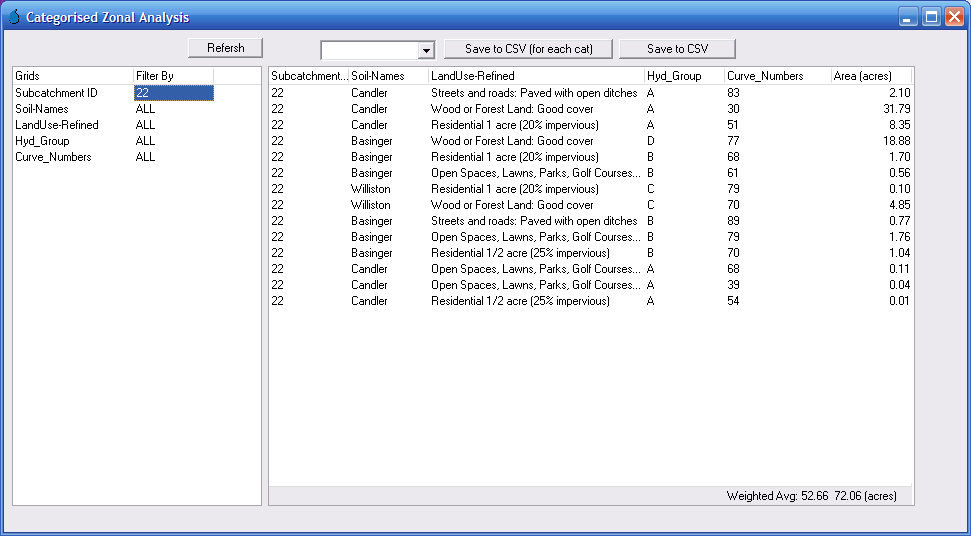
The categorised zonal statistics can be saved to a CSV file for reporting and further analysis if required. To save the currently displayed table select the "Save to CSV" button.
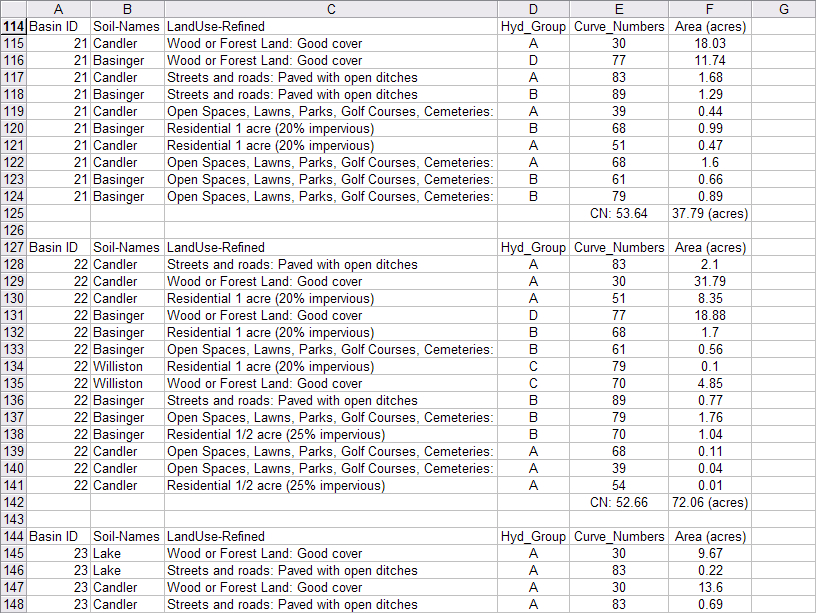
To save all zonal statistics to a CSV file, a method of grouping the statistics together must be selected. This is achieved by selecting a grid layer from the drop down box near the top of the screen. All statistics will be grouped based on unique categories within the selected grid layer. Once this is selected click the "Save to CSV (for each cat)" button. For example, if you were to select 'Subcatchment ID' from the drop down box, the resulting CSV file would be grouped based on Subcatchment ID numbers and would look similar to the following when opened in a spreadsheet, such as Excel:
